This topic contains a solution. Click here to go to the answer
|
|
|

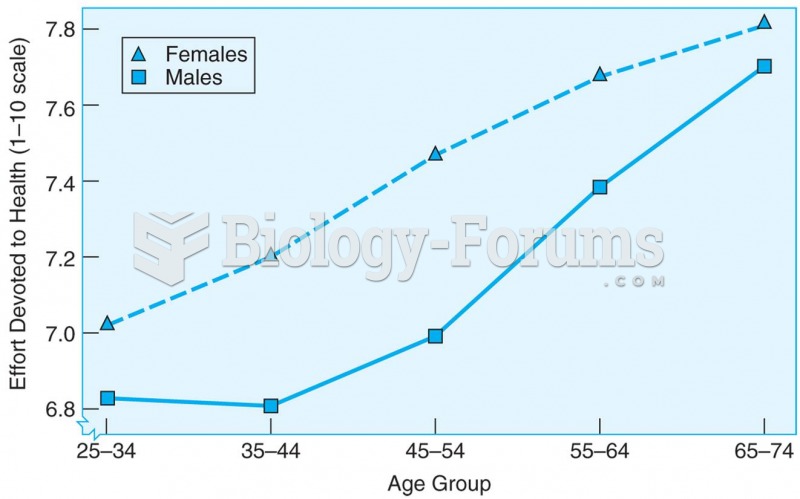 Cross-sectional data showing that the amount of effort spent on personal health care increases with
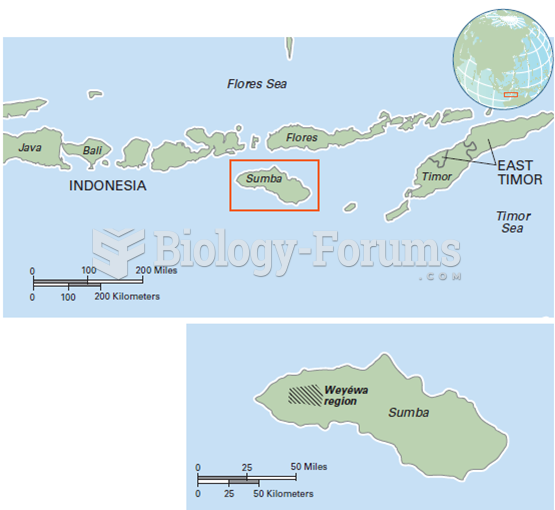 Study of Taste Categories among the Weyéwa of Sumba, Indonesia
 Upward social mobility, though welcome, can place people in a world so different from their world of ...
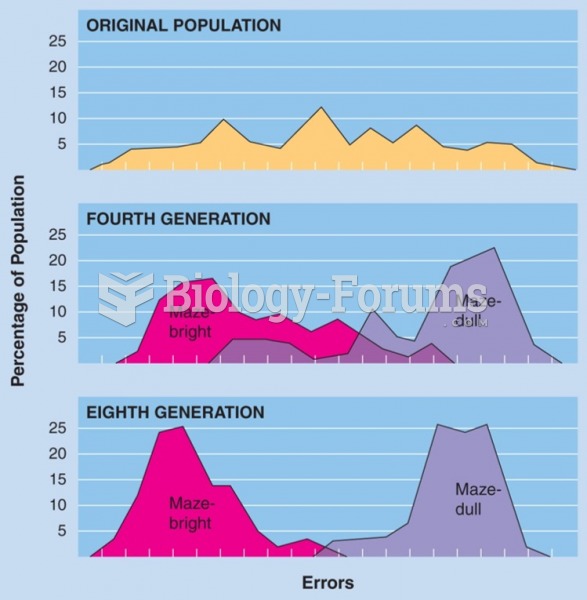 Selective breeding of maze-bright and maze-dull strains of rats by Tryon (1934). (Data from Cooper, ...
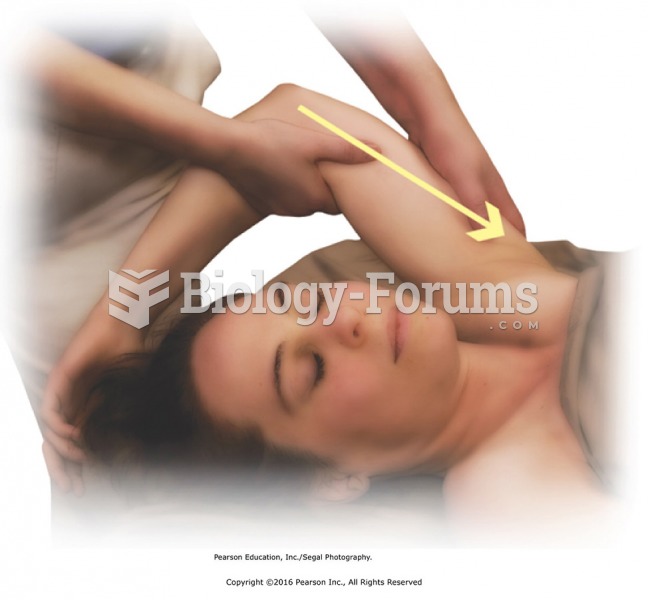 Apply deep effleurage to triceps. Position arm with elbow pointing upward to access the triceps ...
 Demographic Data for India