This topic contains a solution. Click here to go to the answer
|
|
|

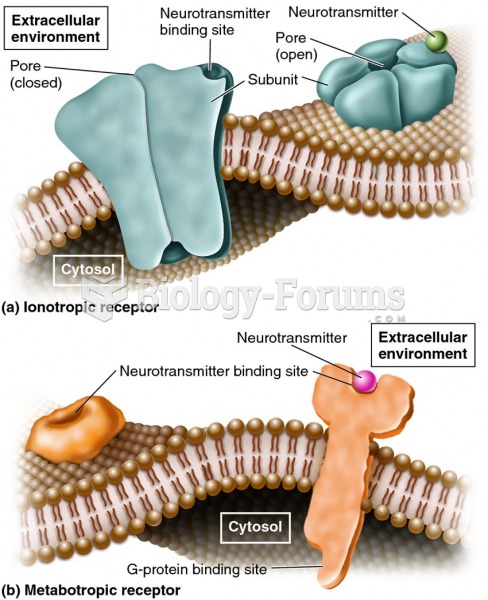 The two major categories of postsynaptic receptors.
 Chest X-ray. A physician is examining chest X-rays with the aid of a plastic model of the bronchial
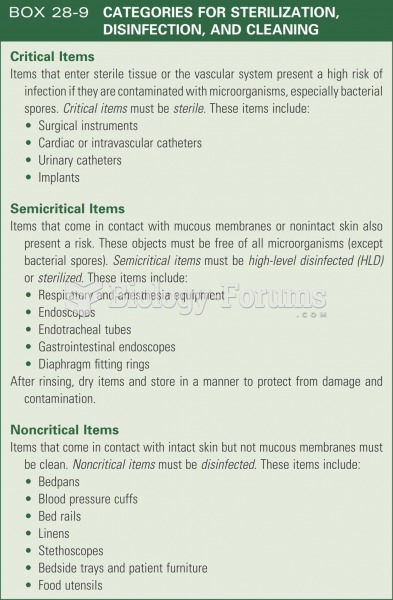 Categories or sterilization, disinfection
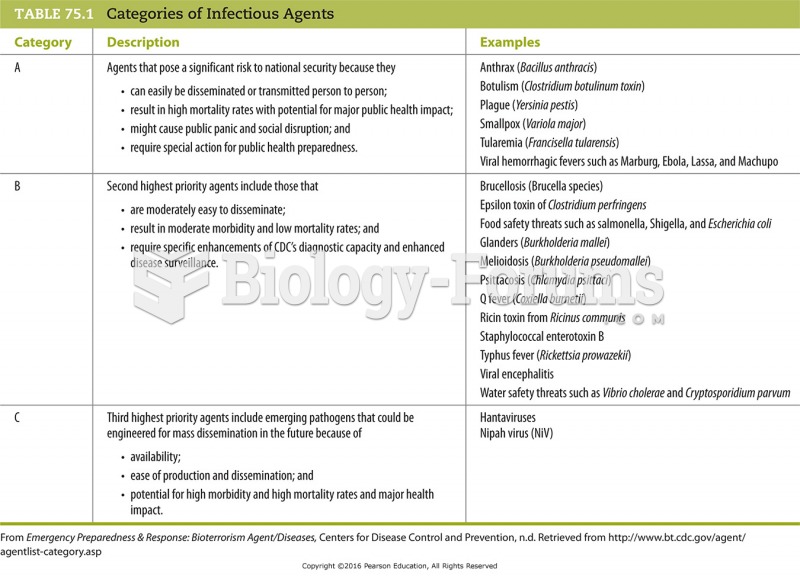 Categories of Infectious Agents
 A 40.0-kg crate is being raised by means of a rope. Its upward acceleration is 2.00 m/s2. What ...
 The Hfr chromosome time-of-entry map is assembled from the recombinant data