This topic contains a solution. Click here to go to the answer
|
|
|

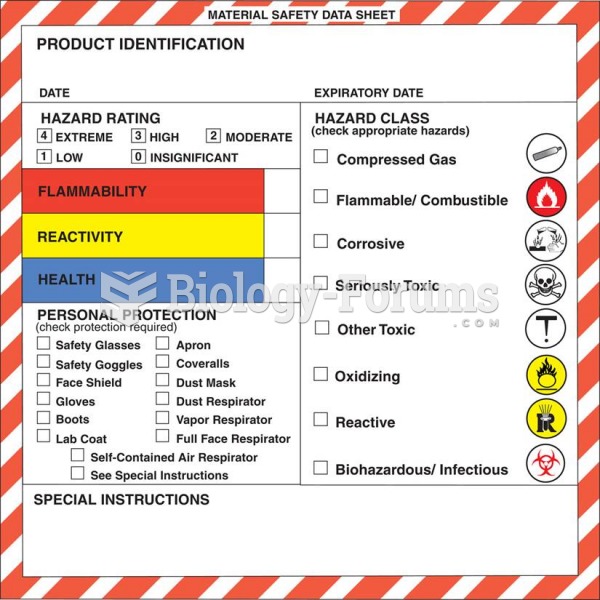 An example of a Material Safety Data Sheet (MSDS).
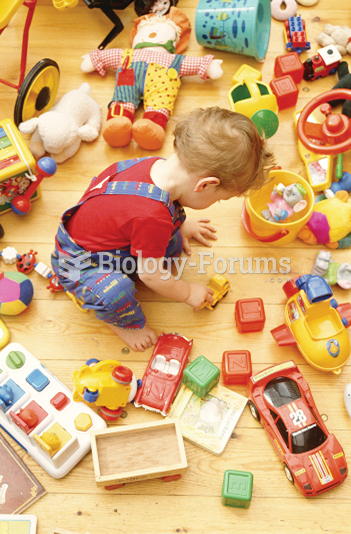 Children may sometimes sort their toys into different categories.
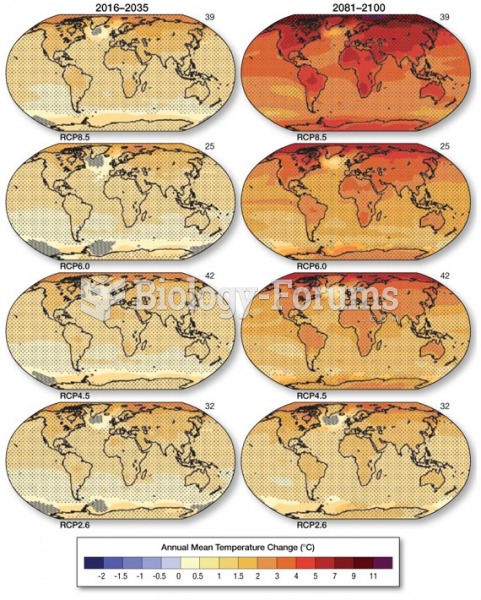 Predicted Temperature Trends Through the 21st Century
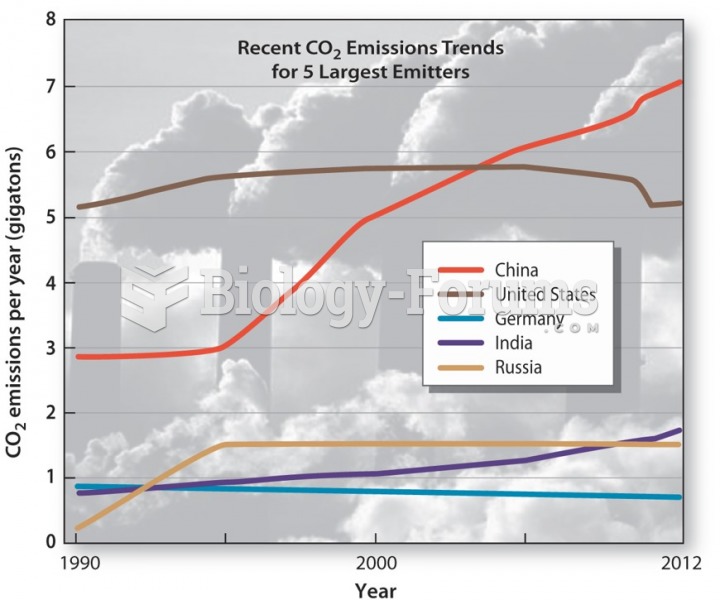 Global Warming: Trends and Tensions
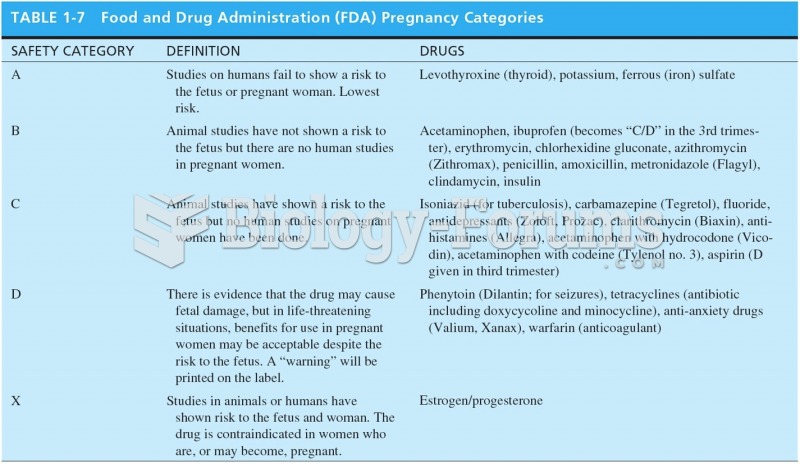 Food and Drug Administration (FDA) Pregnancy Categories
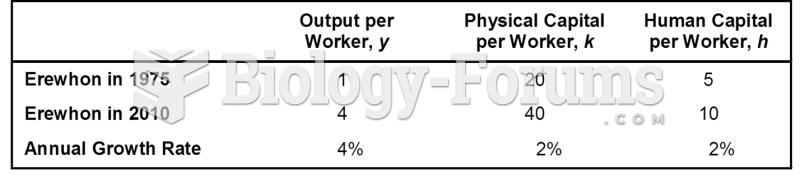 Data for Calculating Productivity Growth in Erewhon