This topic contains a solution. Click here to go to the answer
|
|
|

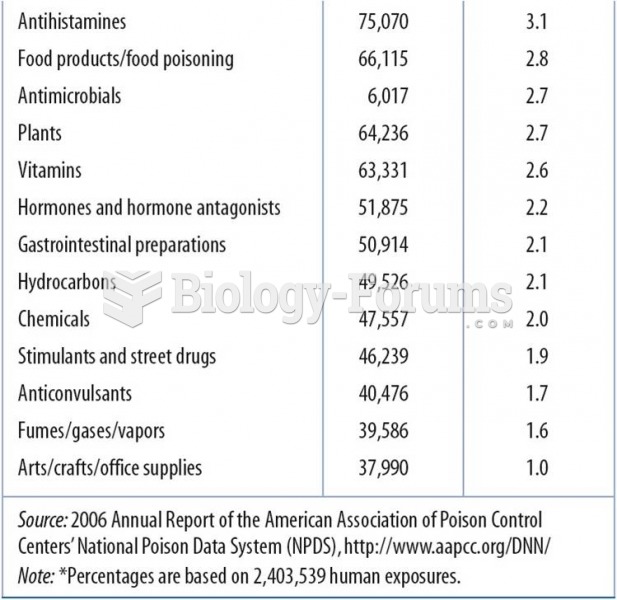 2006 Data:Top 25 Substances Involved in Human Exposures
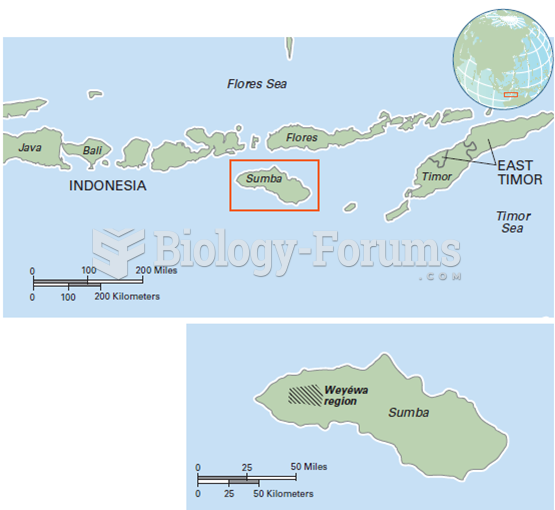 Study of Taste Categories among the Weyéwa of Sumba, Indonesia
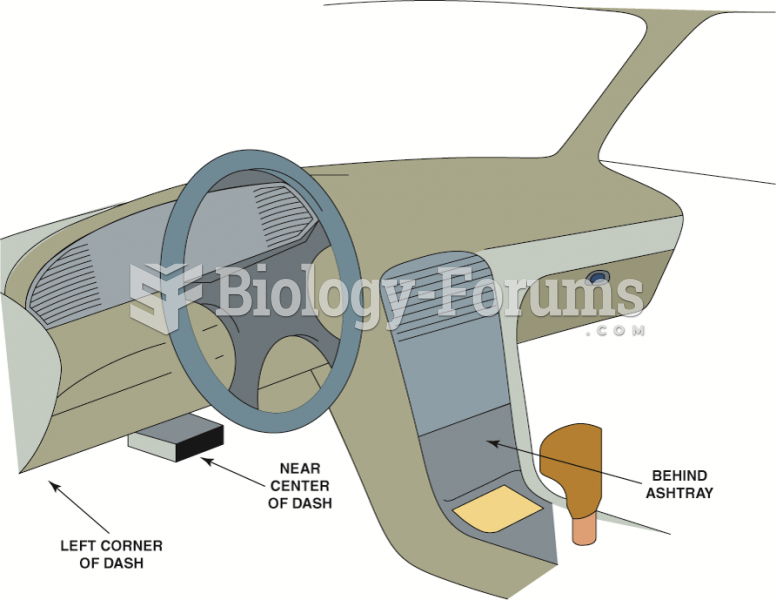 The data link connector (DLC) can be located in various locations.
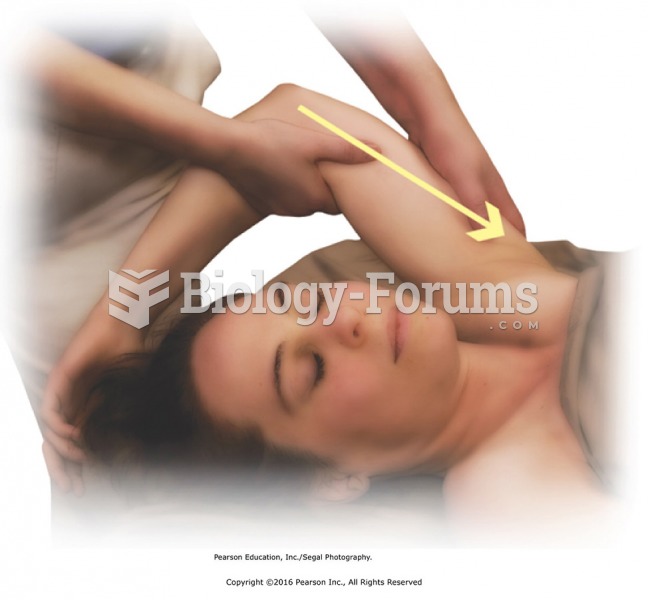 Apply deep effleurage to triceps. Position arm with elbow pointing upward to access the triceps ...
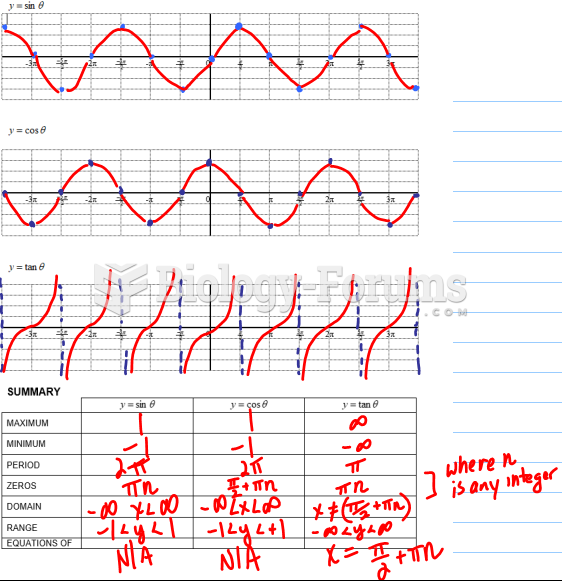 Graphs of Primary Trigonometric Ratios
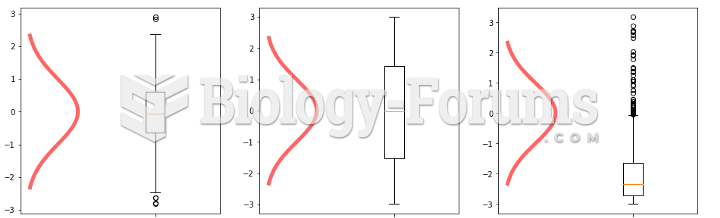 Histograms - Analysis and Data