|
|
|

 Gram Stain of a person's Gum line
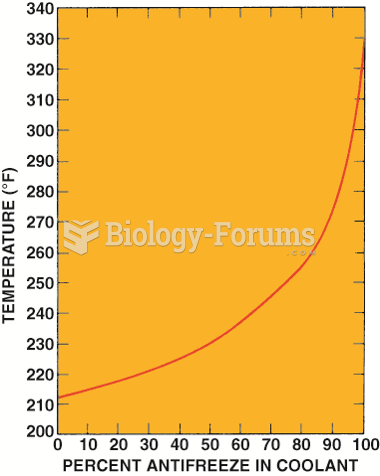 Graph showing how the boiling point of the coolant increases as the percentage of antifreeze in ...
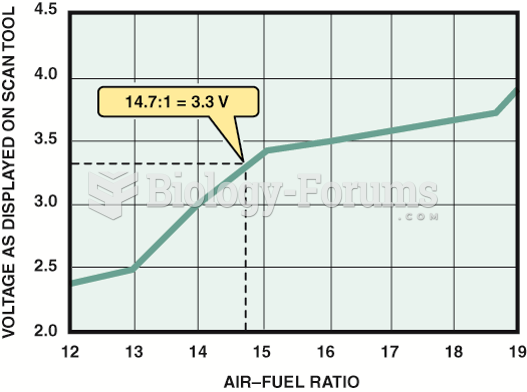 The scan tool can display various voltage but will often show 3.3 volts because the PCM is ...
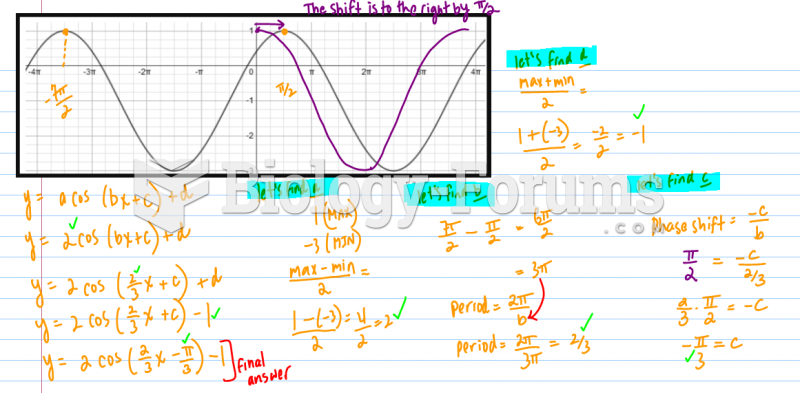 How to find the phase shift from a graph?
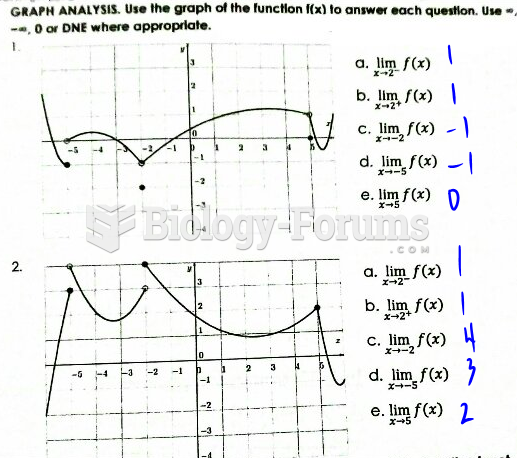 Use the graph of the function f(x) to answer each question.
 calculus homework graph help please