|
|
|

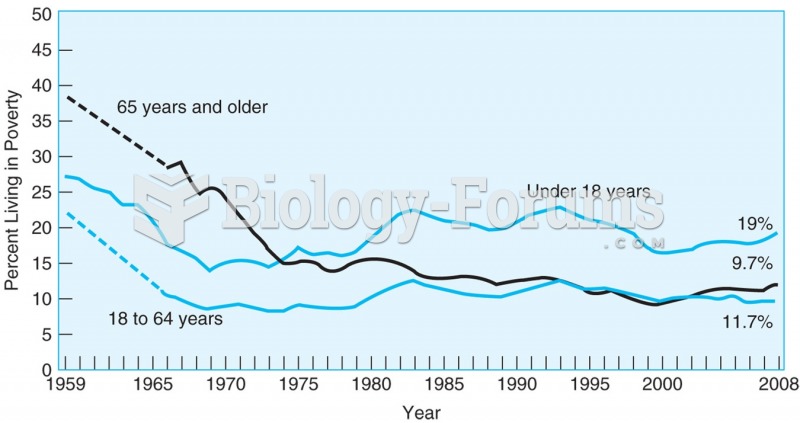 Poverty rates have declined in the last 50 years, and the biggest decline has been for people 65 and ...
 Older people who experienced stressful events in their younger years may show personal growth and ...
 Do you see animals or people first?
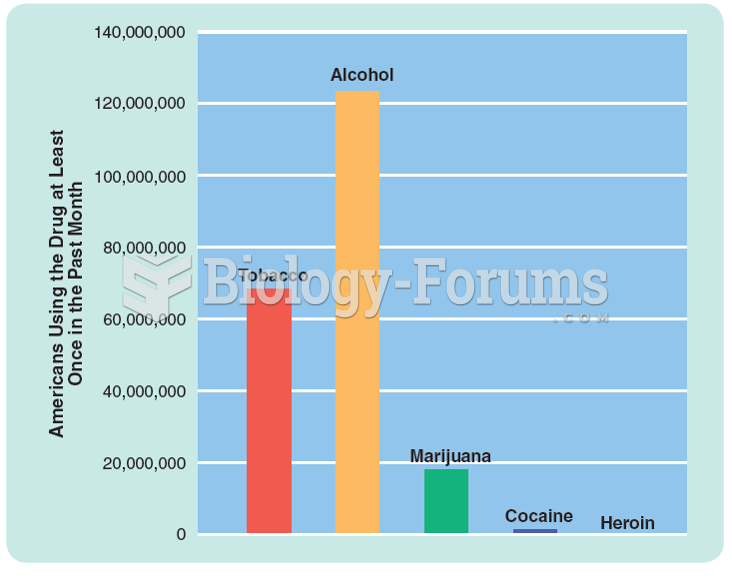 Prevalence of drug use in the United States. Figures are based on a survey of people 12 years of age ...
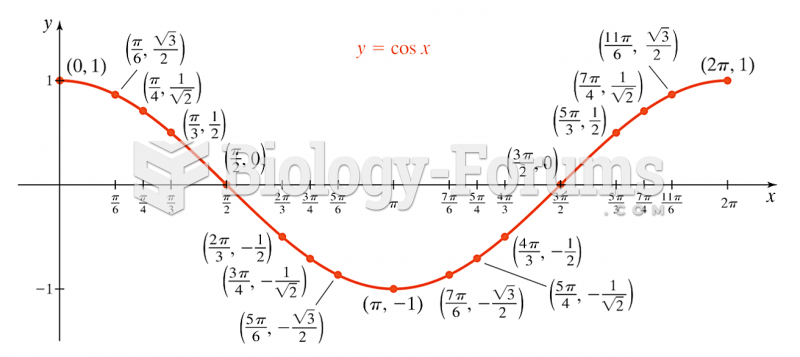 Graph of cos(x)
 Picture graph