This topic contains a solution. Click here to go to the answer
|
|
|

 These bumper stickers show an allegiance to New Age religions
 Demographic Trends and Debates
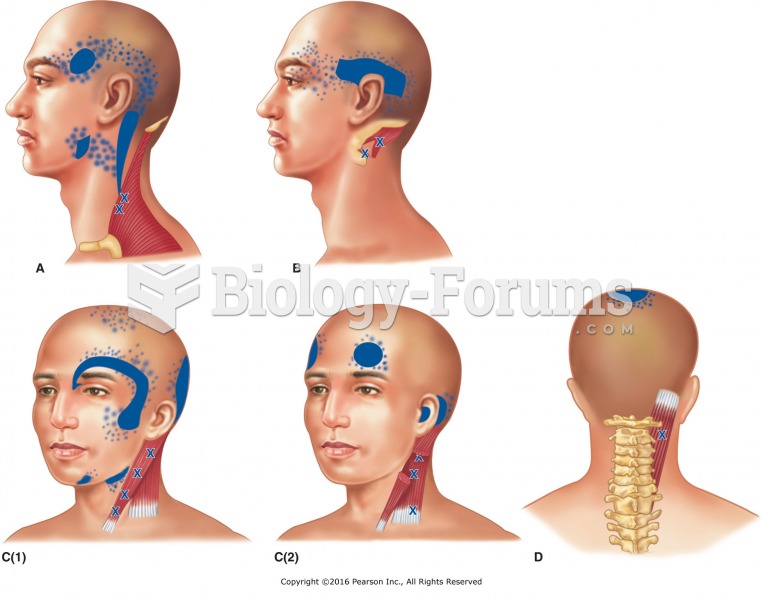 Locations and reference zones of trigger points that cause headaches. A. Upper trapezius. B. ...
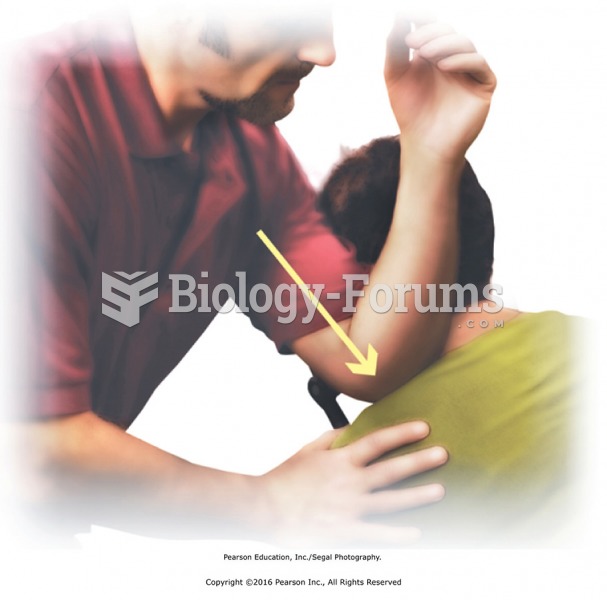 Use of the elbow to apply pressure to trigger points in the trapezius with the receiver in sitting ...
 Pinch the sternocleidomastoid (SCM) muscle at points along its length. Turn head to side to expose ...
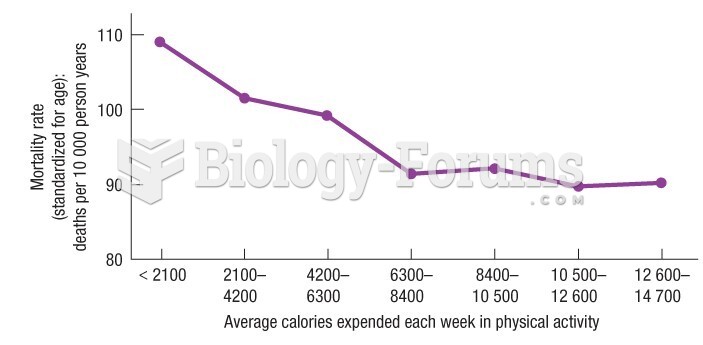 Harvard Alumni Study show who are more physically active in middle adulthood