|
|
|

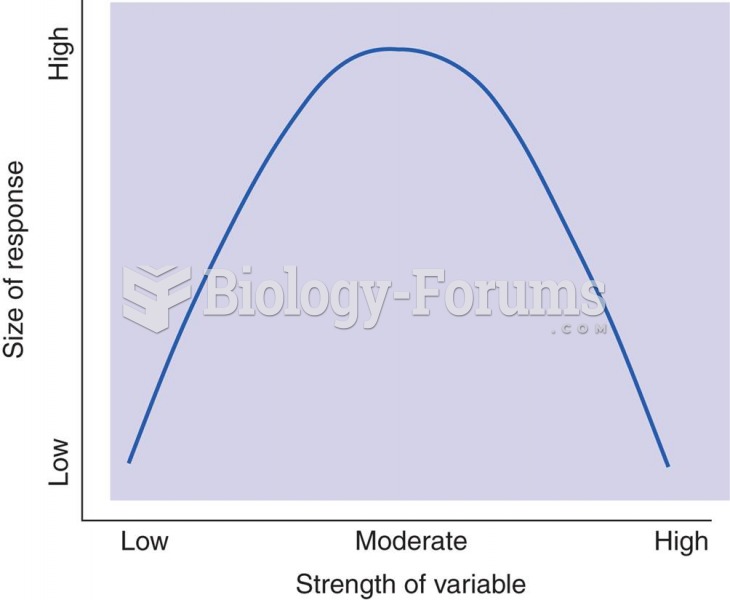 An Inverted U Curve
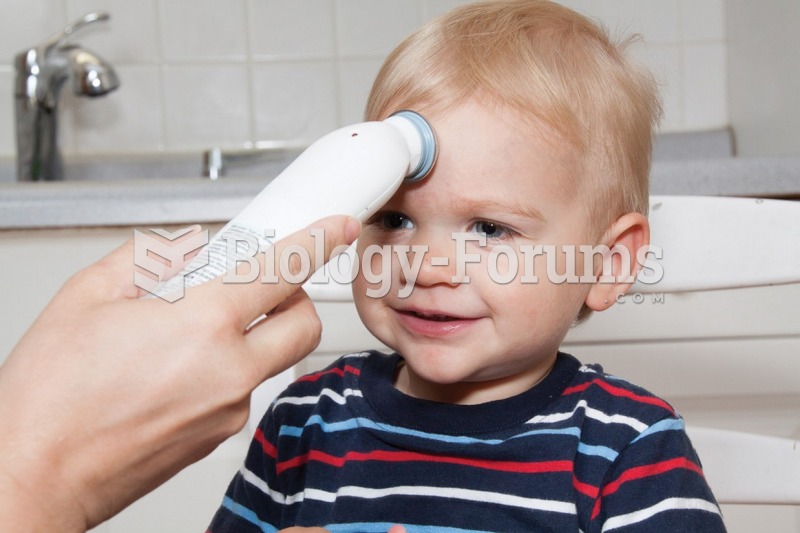 Measuring Temperature Using a Temporal Artery Thermometer
 Cycles of Air Temperature
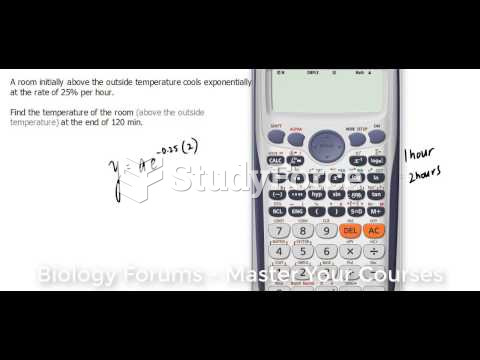 Find the temperature of the room (above the outside temperature) at the end of 120 min
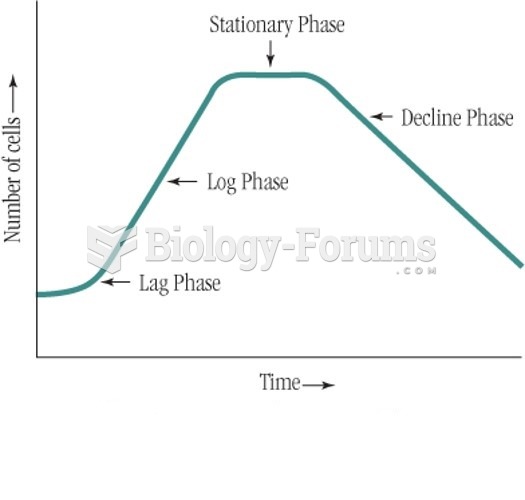 Bacteria growth curve
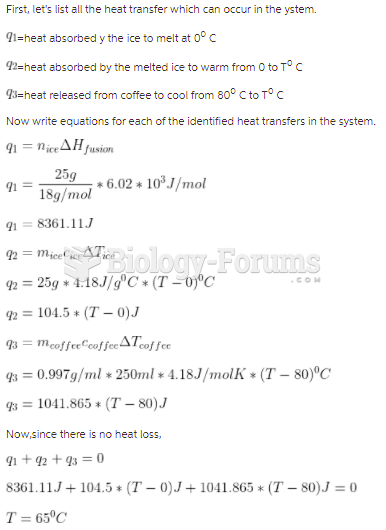 What would be the appropriate equilibrium temperature of a system obtained by adding 25.0 g of ...