This topic contains a solution. Click here to go to the answer
|
|
|

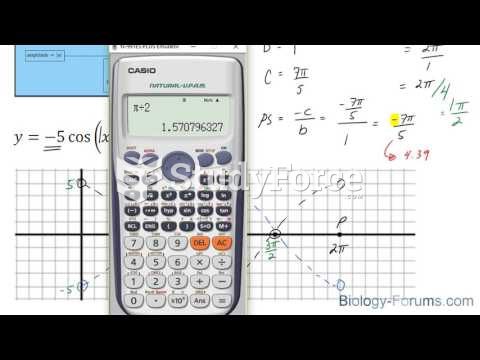 How to plot a cosine function containing an amplitude and phase-shift (Question 2 of 2)
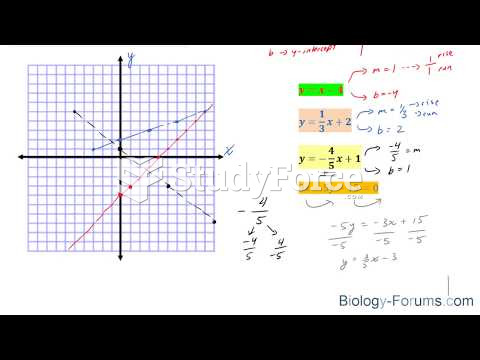 How to graph line equations without a table of values
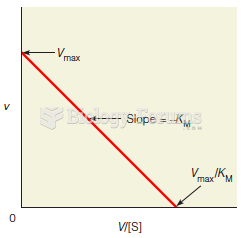 An Eadie–Hofstee plot
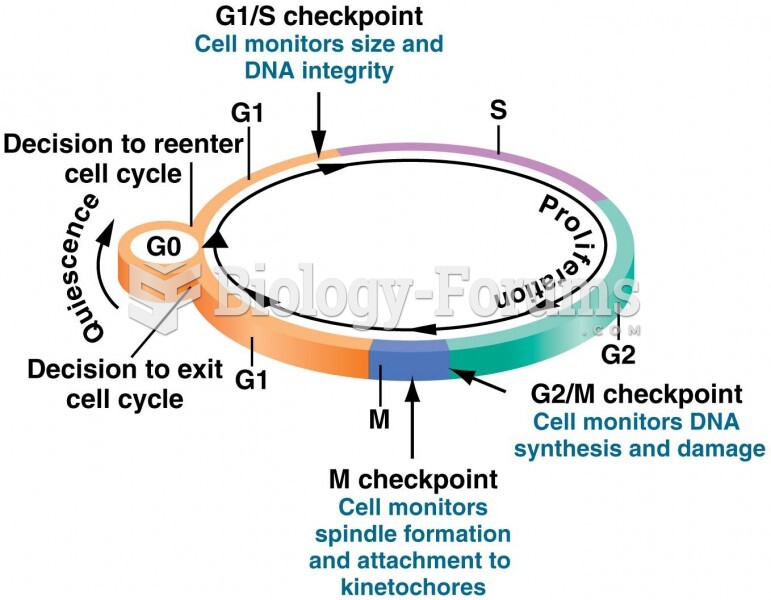 Checkpoints and proliferation decision points monitor the progress of the cell through the cell cycl
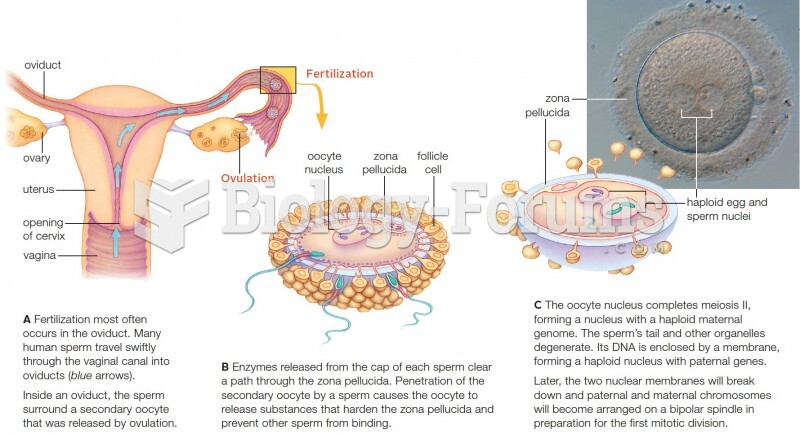 Events in human fertilization. The light micrograph shows a fertilized human oocyte.
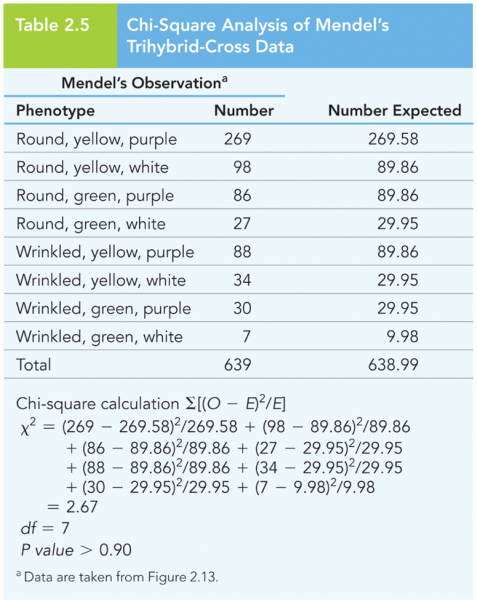 Chi-Square Analysis of Mendel’s Trihybrid-Cross Data