This topic contains a solution. Click here to go to the answer
|
|
|

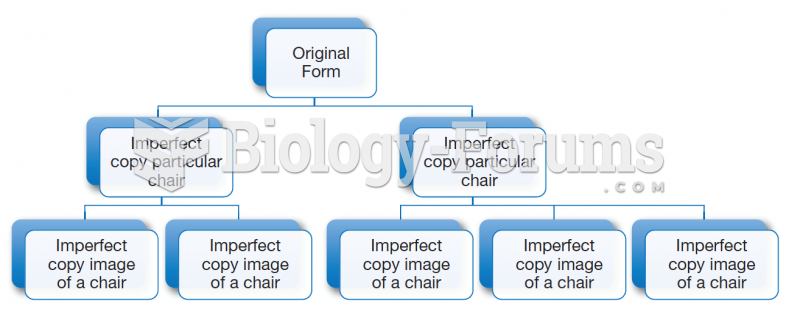 Relation between form, particular objects, and images in Plato’s Line.
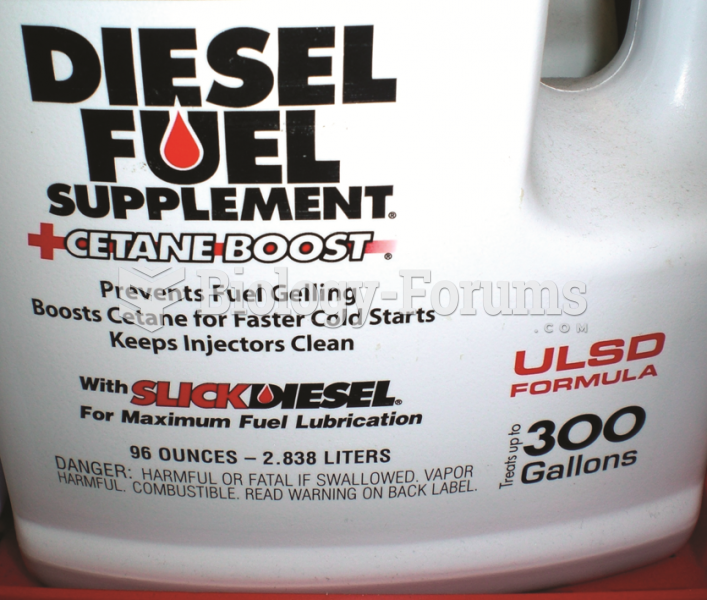 Many diesel fuel additives increase the cetane rating which results in improved fuel economy.
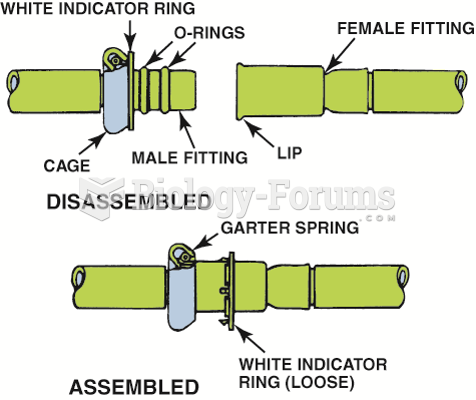 Some Ford metal line connections use springlocks and O-rings.
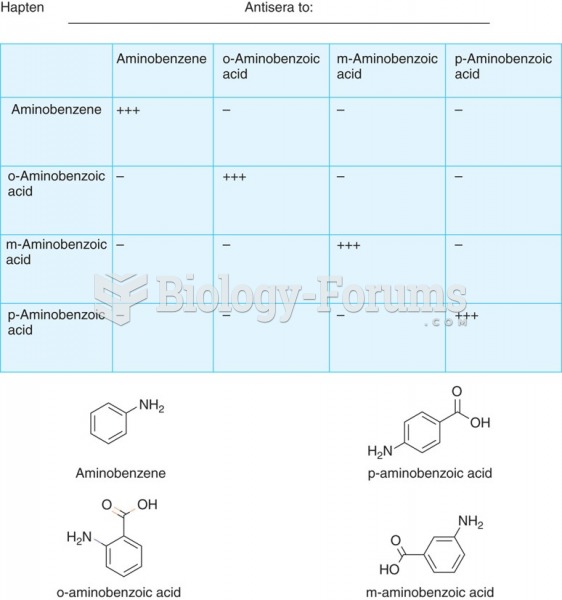 Landsteiner's experiment demonstrating the exquisite specificity of the immune system.
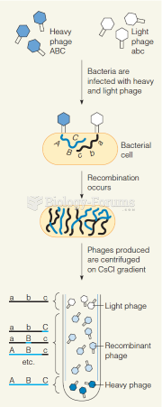 The Meselson–Weigle experiment
 Trihybrid cross to verify independent assortment