This topic contains a solution. Click here to go to the answer
|
|
|

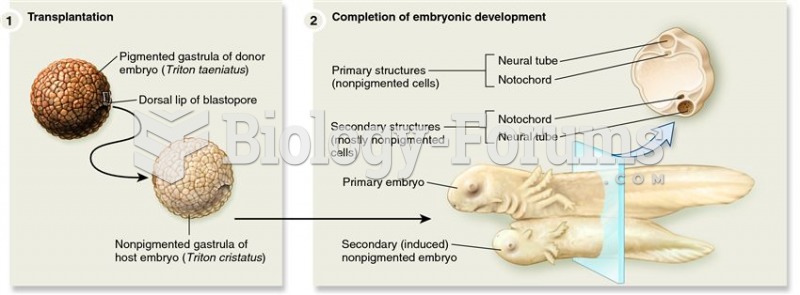 Experiment on newt embryos that led to the discovery of Spemann's organizer.
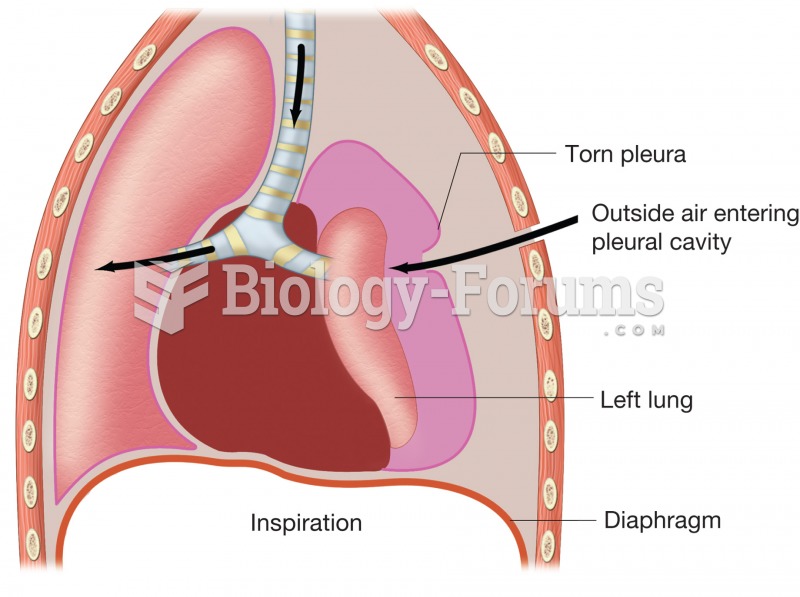 Pneumothorax. Figure illustrates how puncture of thoracic wall and tearing of pleural membrane allow
 How to graph complex numbers
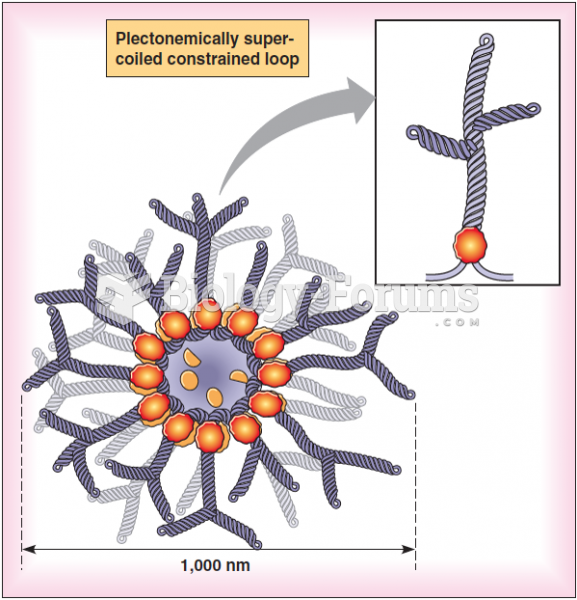 Structure of a bacterial nucleoid, showing independent domains of supercoiling
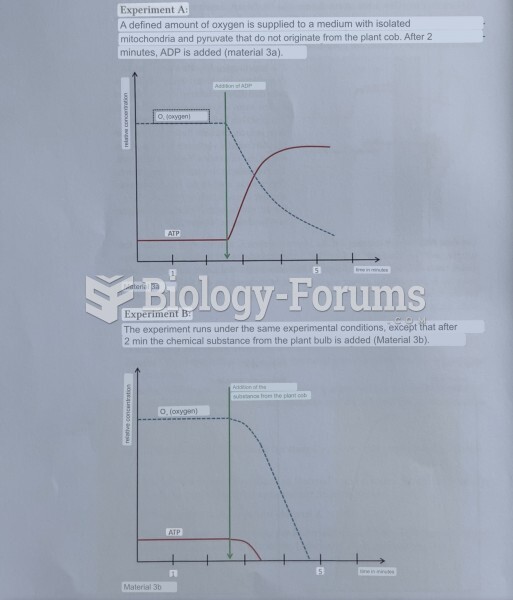 Evaluating an experiment (metabolic pathway)
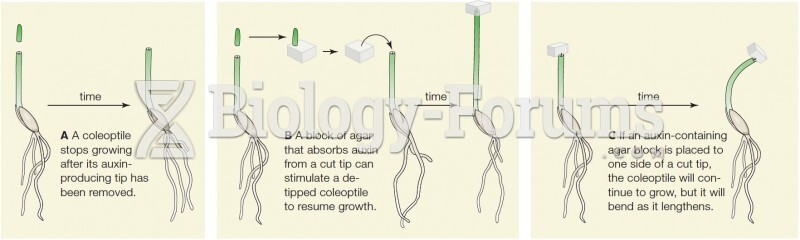 Experiment: Response to Auxin