This topic contains a solution. Click here to go to the answer
|
|
|

 Solar Neutrino Experiment
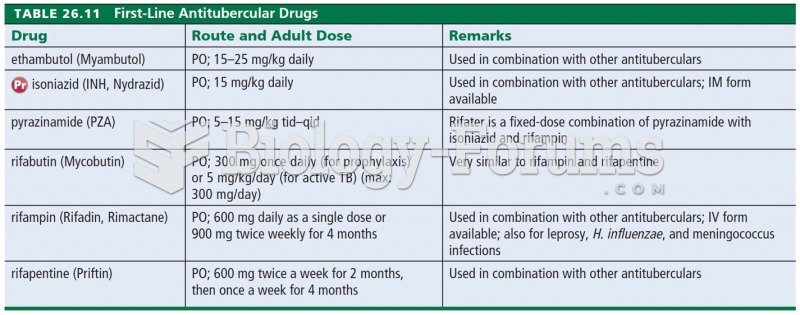 First Line Antitubercular Drugs
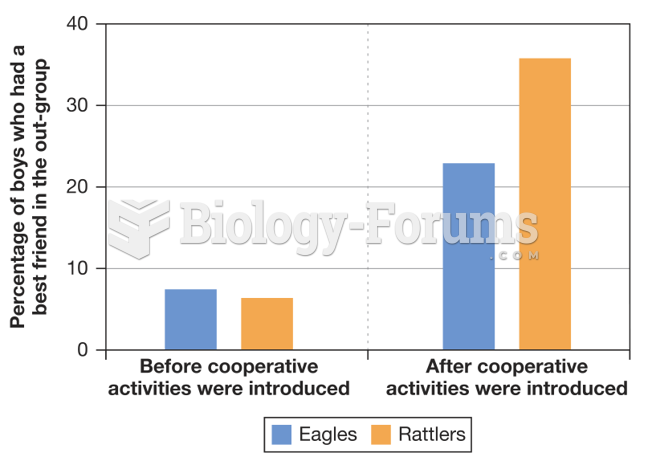 The Experiment at Robbers Cave
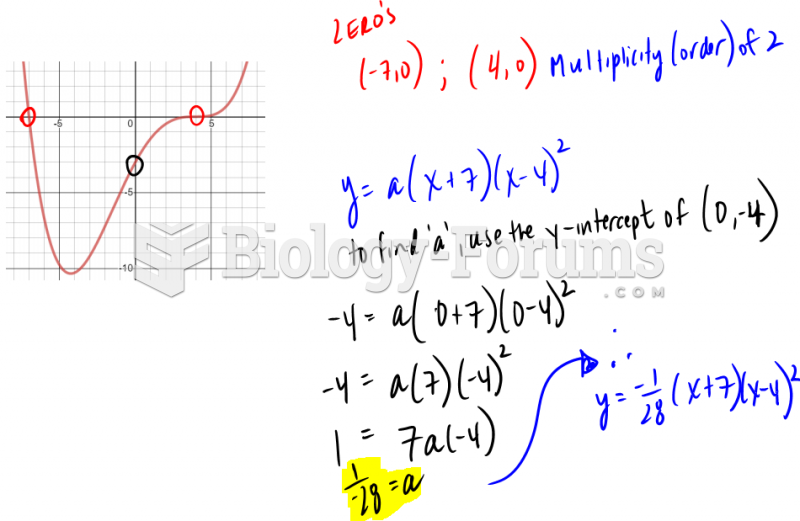 Converting cubic graph to function
 Graph the function by hand & label key points on graph:
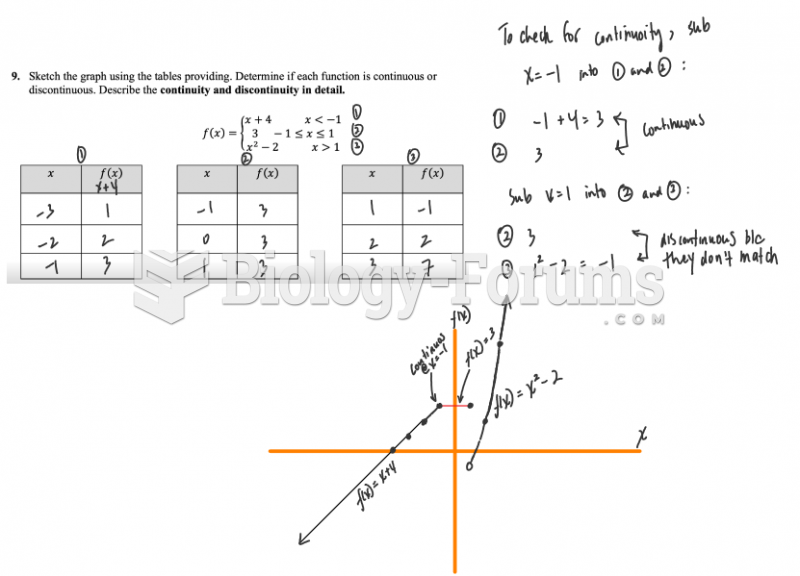 Sketch the graph using the tables providing. Determine if each function is continuous or ...