This topic contains a solution. Click here to go to the answer
|
|
|

 A, A nurse is adding a medication to an IV line as a piggyback
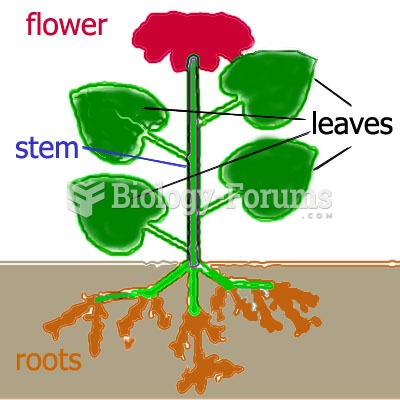 Plant Diagram
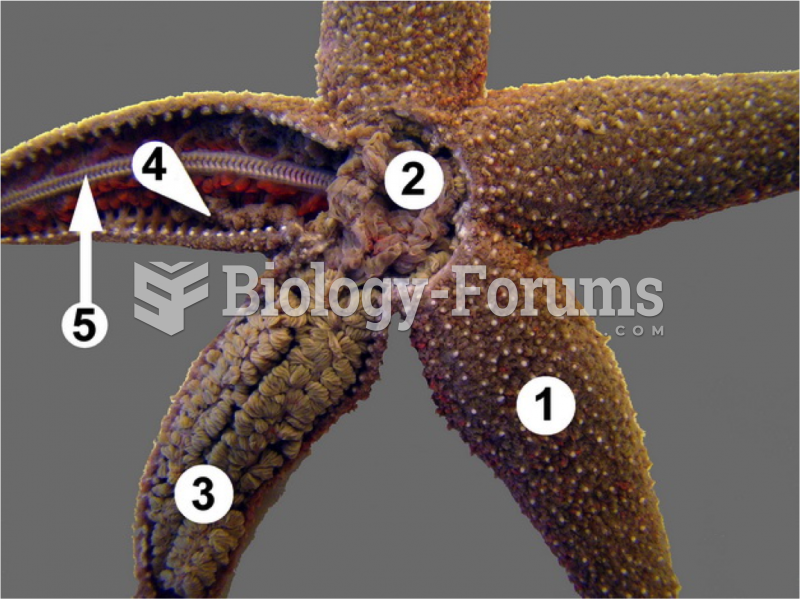 Echinoderm Diagram with labels
 Rectification column Schematic diagram
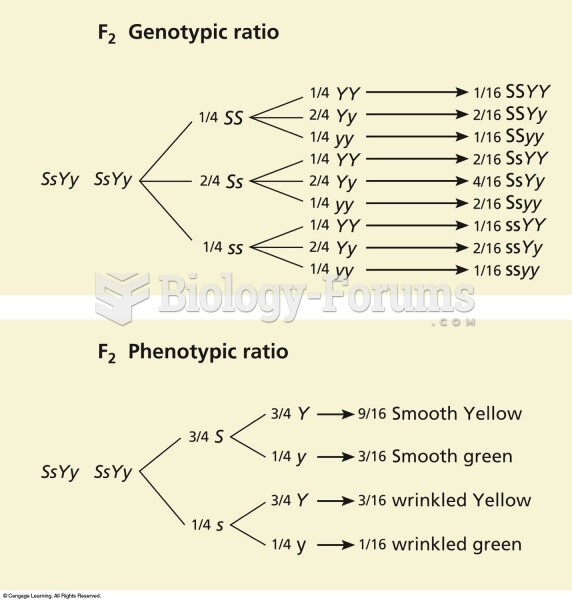 The phenotypic and genotypic ratios of a dihybrid cross can be derived using a branched-line method
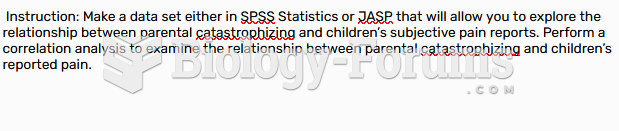 Table - Correlation Analysis