This topic contains a solution. Click here to go to the answer
|
|
|

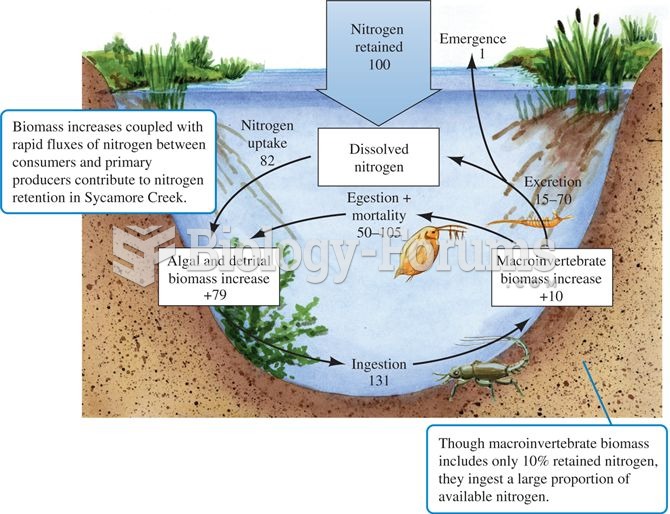 Nitrogen fluxes in Sycamore Creek, Arizona (data from Grimm 1988).
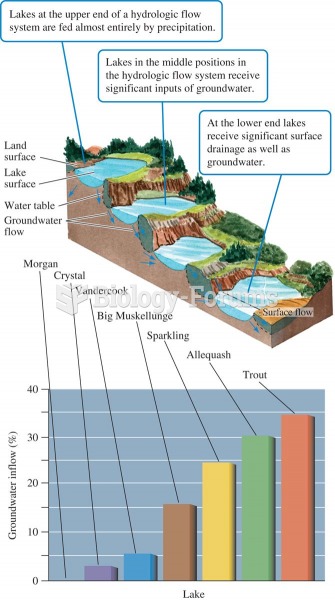 Lake position in the landscape and proportion of water received as groundwater (data from Webster et
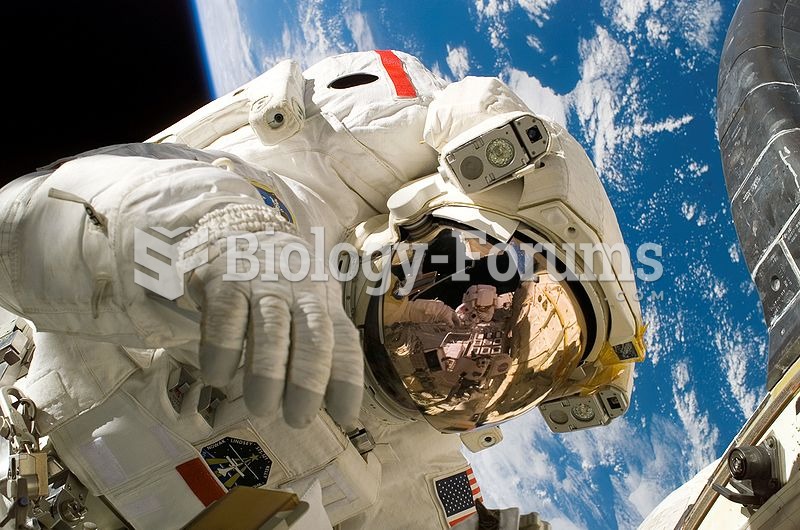 Astronaut Piers Sellers during the third spacewalk of STS-121, a demonstration of orbiter heat shiel
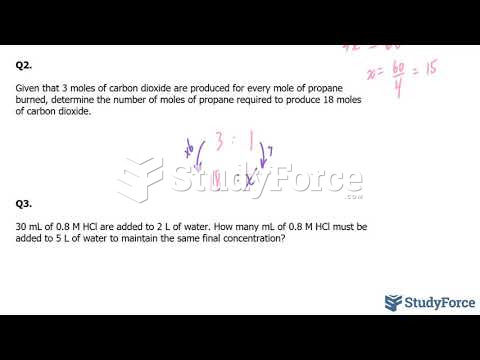 How to solve ratio problems related to chemistry
 How to calculate the mean for grouped data
 Two techniques for holding and inserting an otoscope