|
|
|

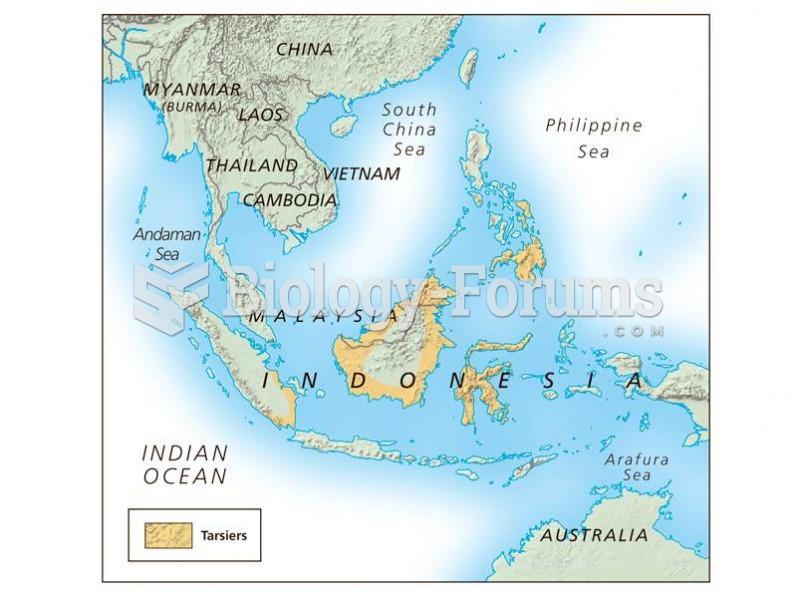 The distribution of the tarsier.
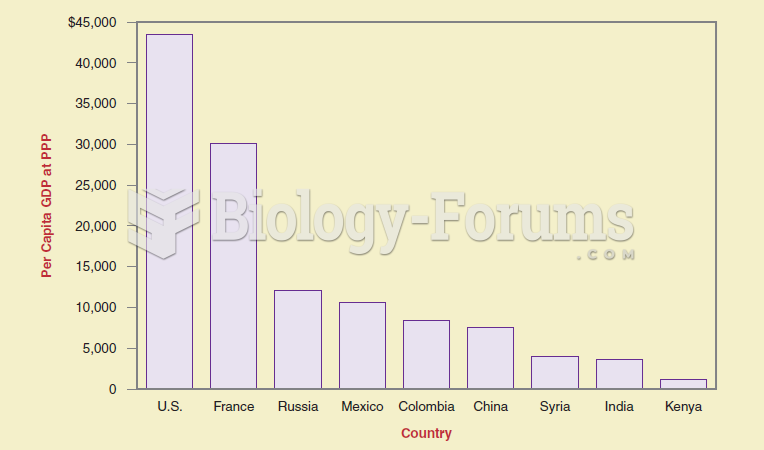 If you want to show differences between items at the same time, a bar graph is more effective than a
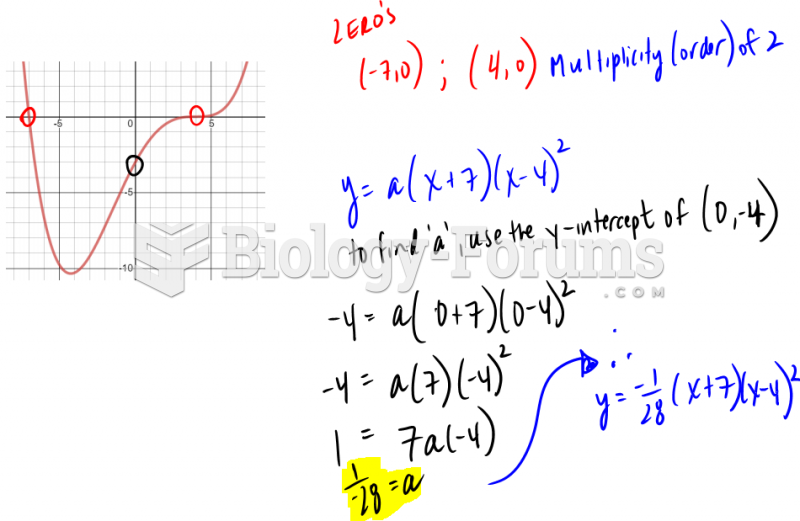 Converting cubic graph to function
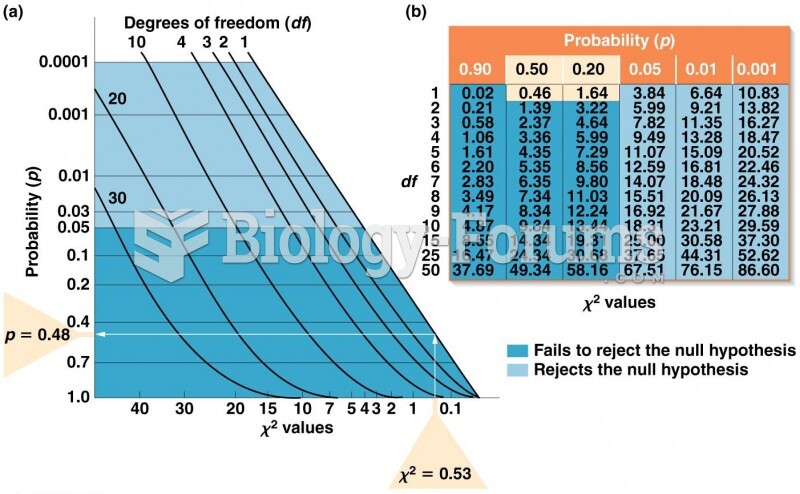 (a) Graph for converting values to p values. (b) Table of values for selected values of df
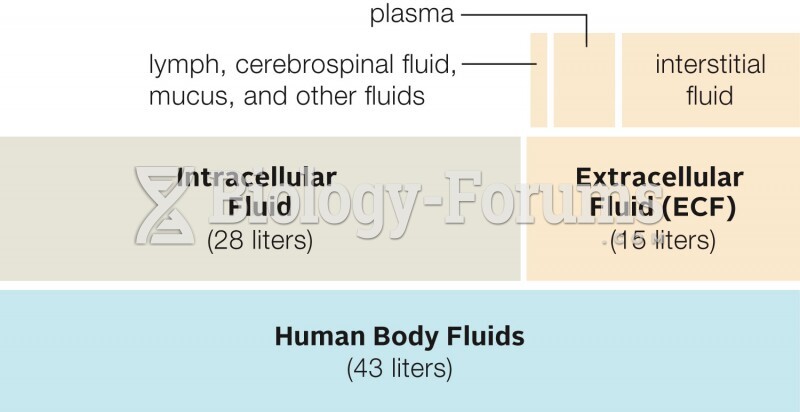 Distribution of Fluids in a Human Body
 The frequency distribution of the allele in Southeast Asia and the Pacific Islands