This topic contains a solution. Click here to go to the answer
|
|
|

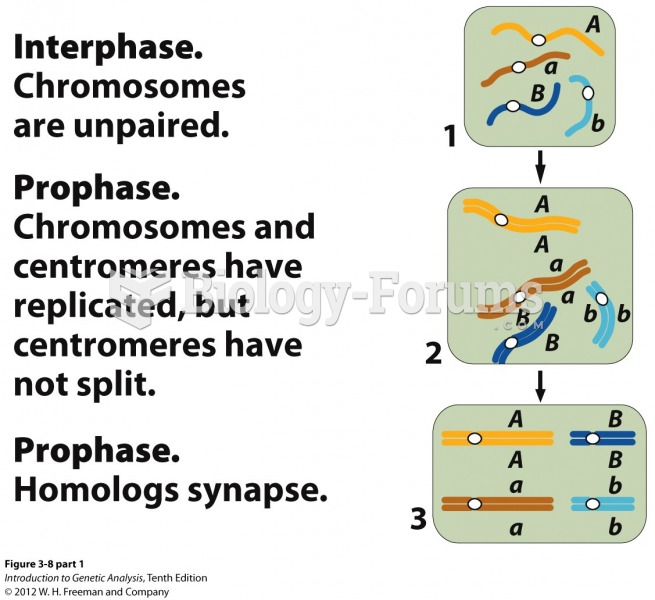 Independent assortment of chromosomes at meiosis explains Mendel's ratio
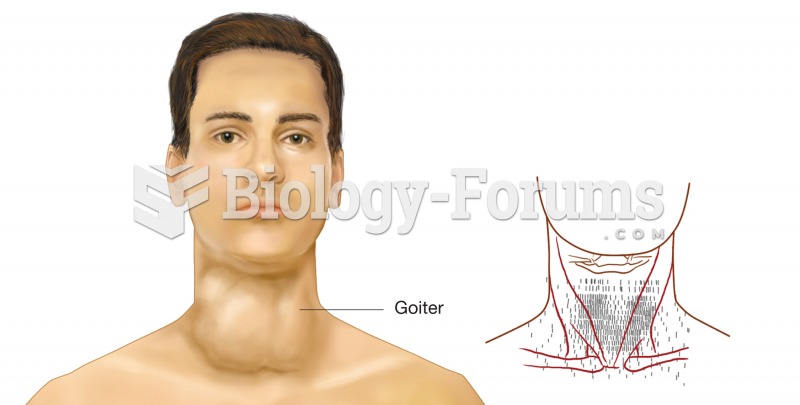 Thyroid scan. The right image is the data from a thyroid scan, printed on a superimposed map of the
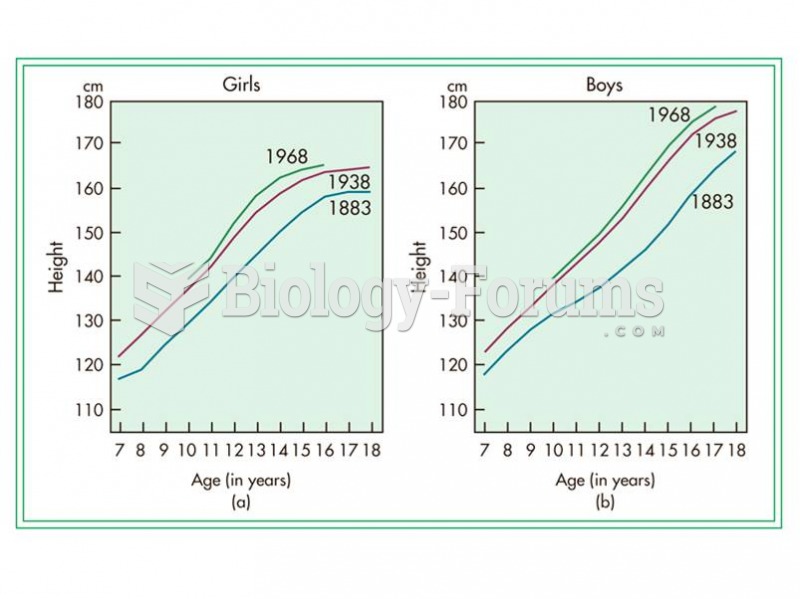 The secular trend in growth as measured in Swedish (a) girls and (b) boys between 1883 and 1968.
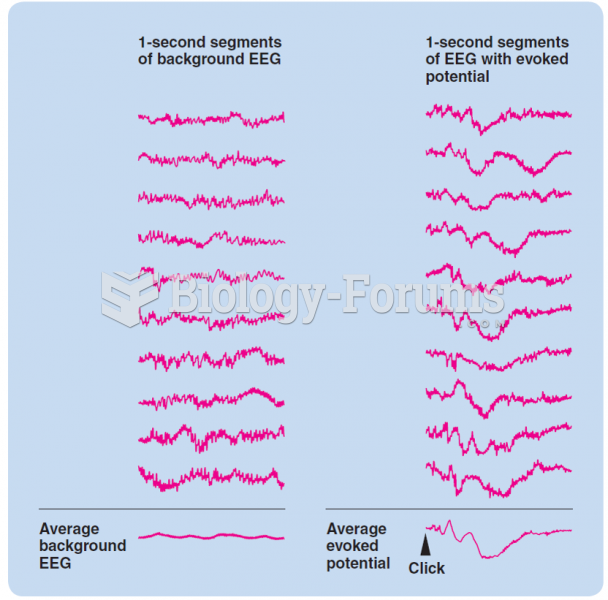 The averaging of an auditory evoked potential. Averaging increases the signal-to-noise ratio.
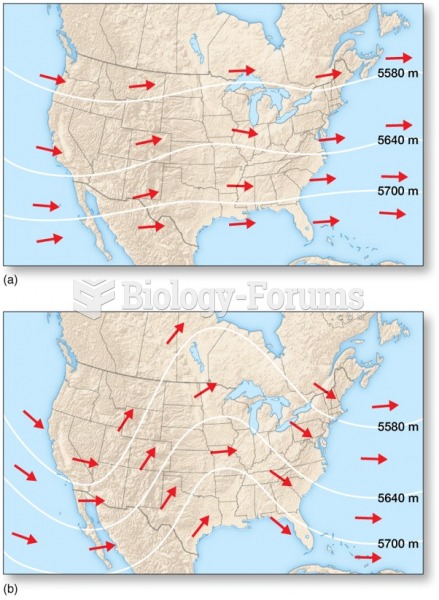 Flow Patterns and Large-Scale Weather
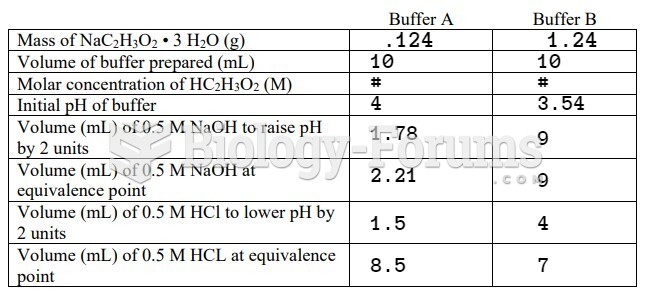 data
data