This topic contains a solution. Click here to go to the answer
|
|
|

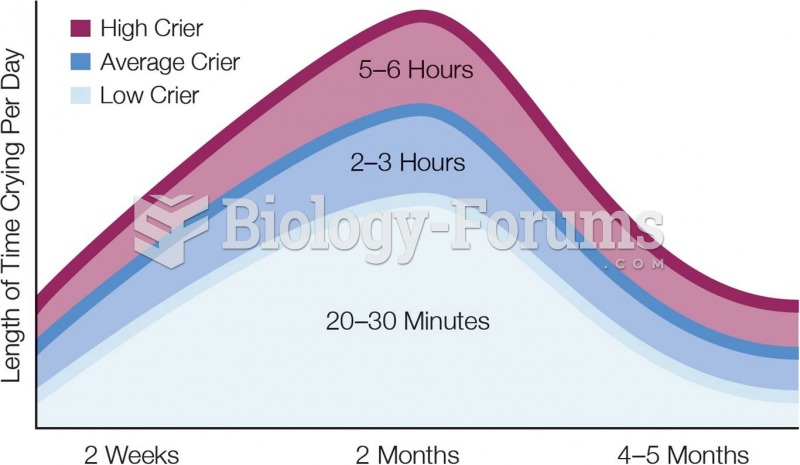 Crying Frequency in the Early Months In their first months of life, infants often cry for no appare
 Two-point linear perspective.
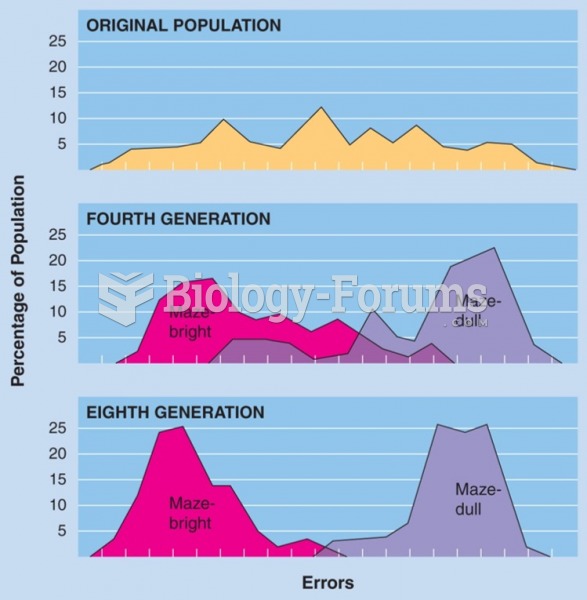 Selective breeding of maze-bright and maze-dull strains of rats by Tryon (1934). (Data from Cooper, ...
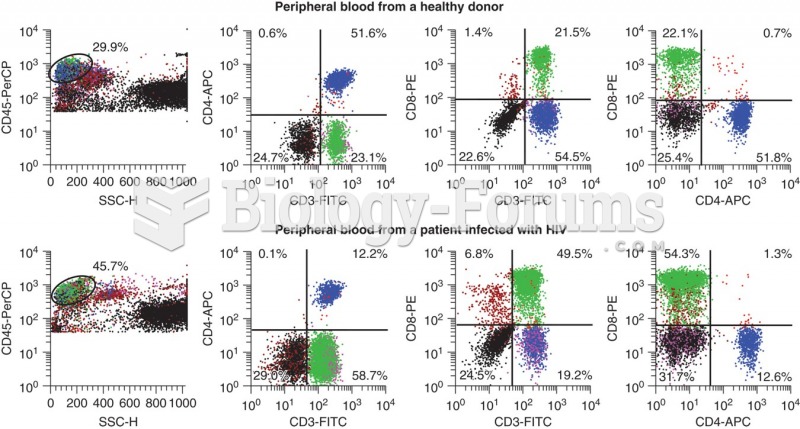 Flow data for a healthy donor (top panel) and a HIV positive patient. CD3 is a T-cell marker, CD4 is ...
 Two-point discrimination
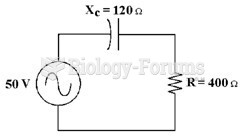 If the frequency equals 60 Hz in Figure 10-1, what is the value of capacitance?