|
|
|

 Use of the tympanic thermometer to measure body temperature.
 Oxisol Profile
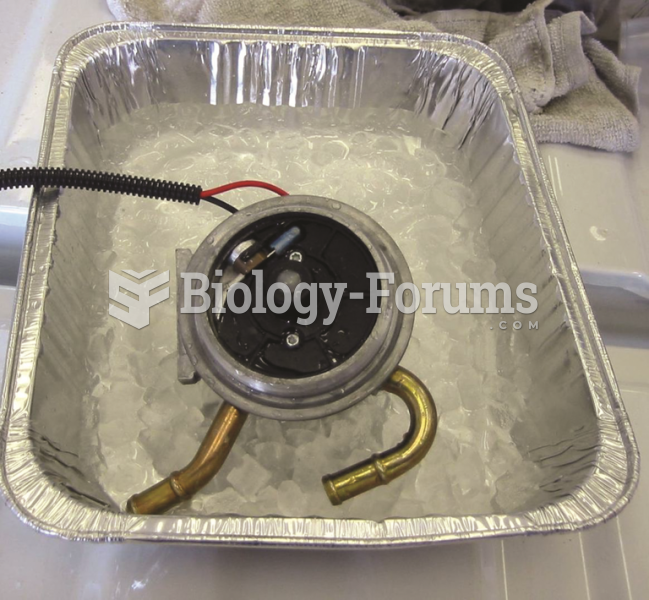 Using an ice bath to test the fuel temperature sensor.
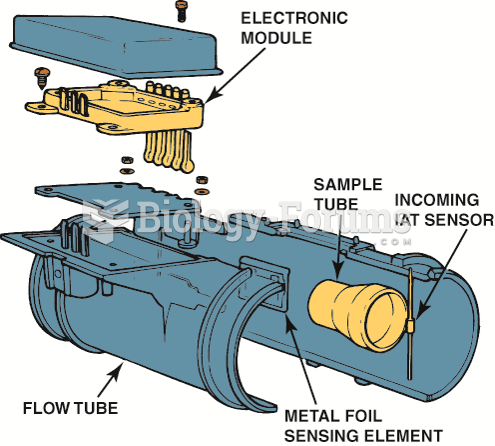 This five-wire mass air flow sensor consists of a metal foil sensing unit, an intake air temperature ...
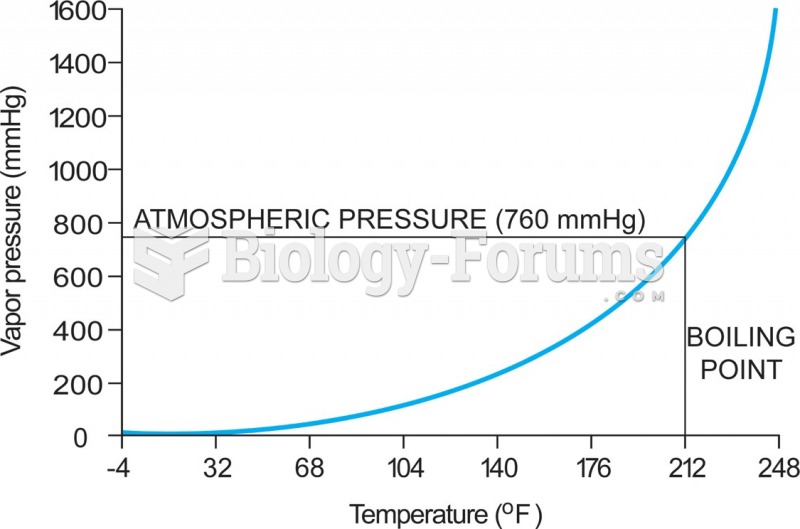 5-4 The relationship between vapor pressure and temperature—in this case for water. As the ...
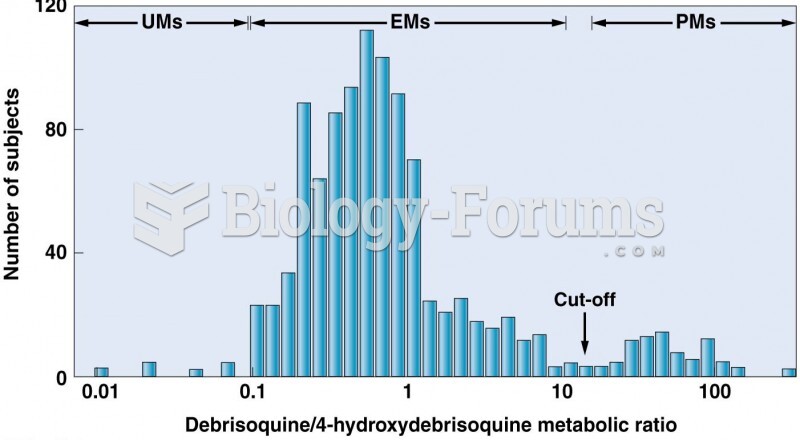 CYP2D6 pharmacogenetic profile in a Swedish population