This topic contains a solution. Click here to go to the answer
|
|
|

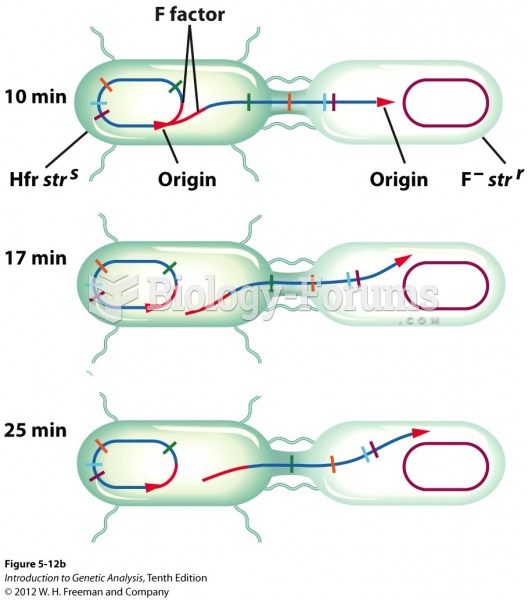 Tracking time of marker entry generates a chromosome map
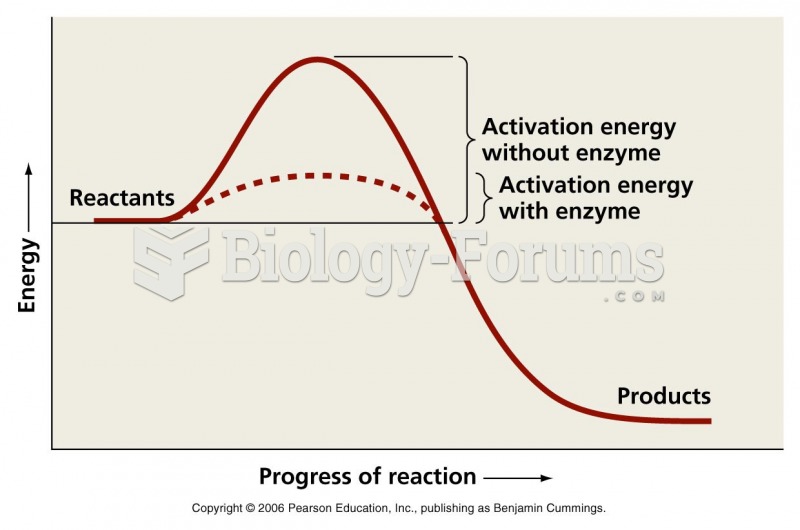 Activation energy graph
 Under what conditions can part-time employment in high school be a negative influence on school ...
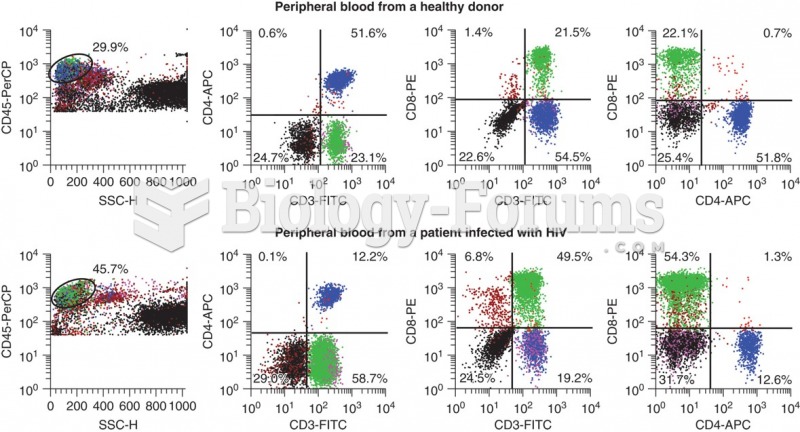 Flow cytometry data that shows the differences in CD3+ CD4+ cells that occur with HIV infection. ...
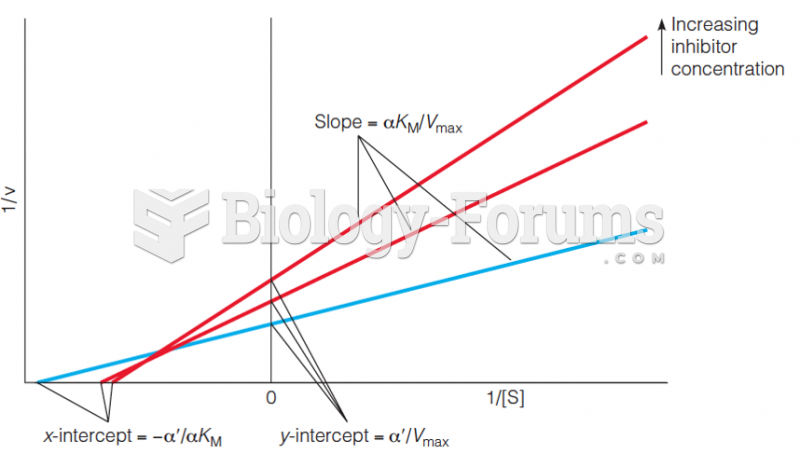 Lineweaver–Burk plot for mixed inhibition kinetics
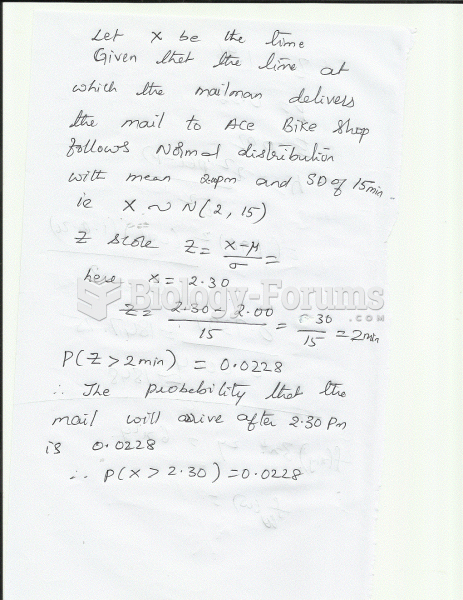 The time at which the mailman delivers the mail to Ace Bike Shop follows a normal distribution ...