This topic contains a solution. Click here to go to the answer
|
|
|

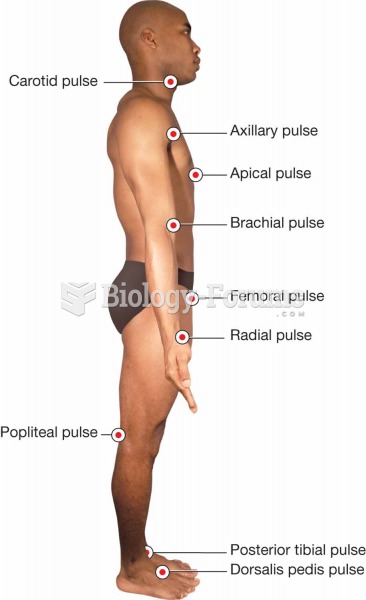 Pulse points.
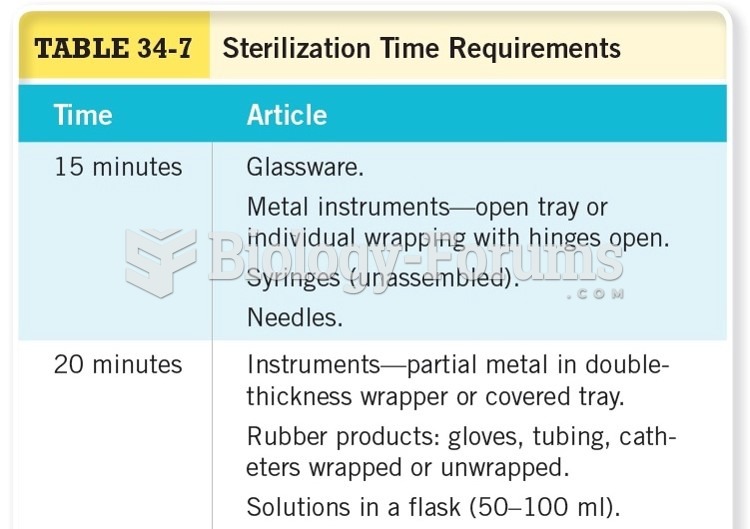 Sterilization Time Requirements
 Use two hands to squeeze both sides of the arm at the same time. Apply from shoulder to wrist. ...
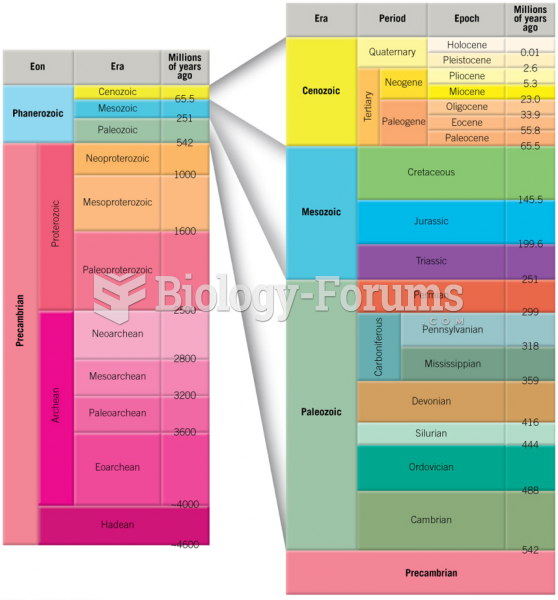 The Geologic Time Scale
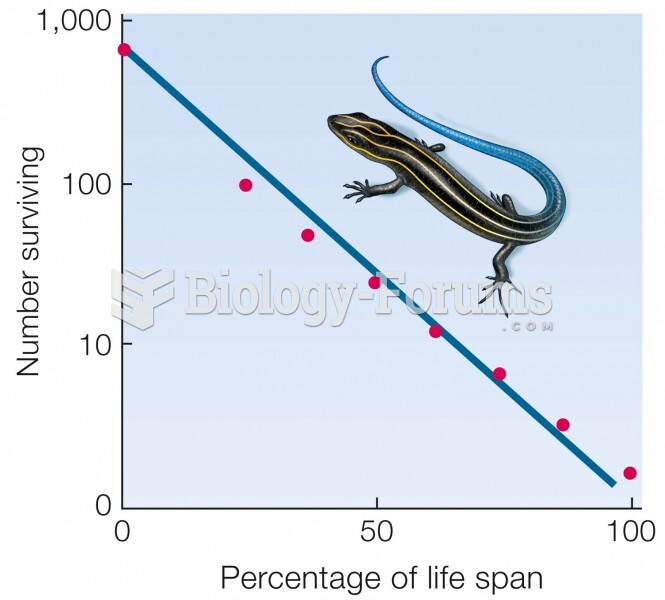 Type II curve. Mortality does not vary with age. Data for five-lined skink (Eumeces fasciatus).
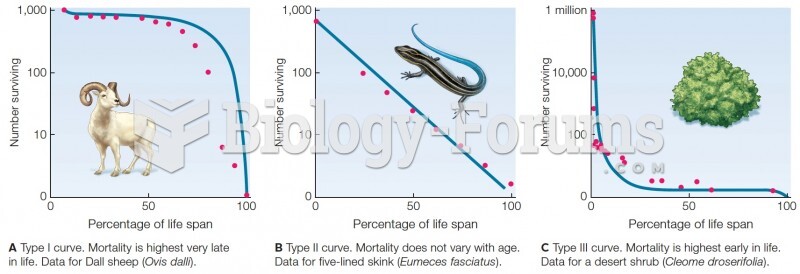 Survivorship curves. Blue lines are theoretical curves. Red dots are data from field studies.