This topic contains a solution. Click here to go to the answer
|
|
|

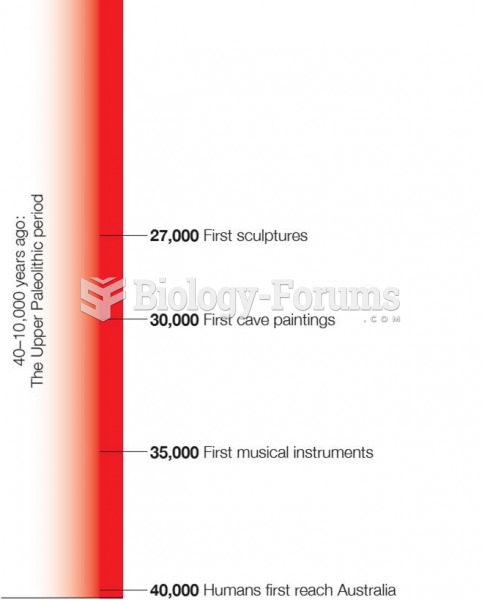 Time Line of Human History From Upper Paleolithic Period to the Present
 Time Estimates for Specific Office Procedures Cont.
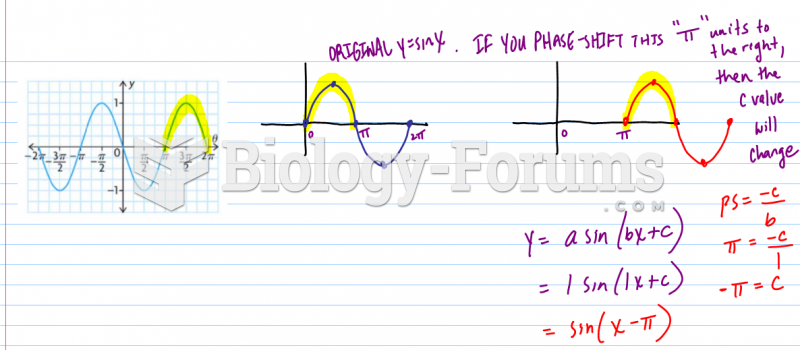 How to find the possible equations of a graph?
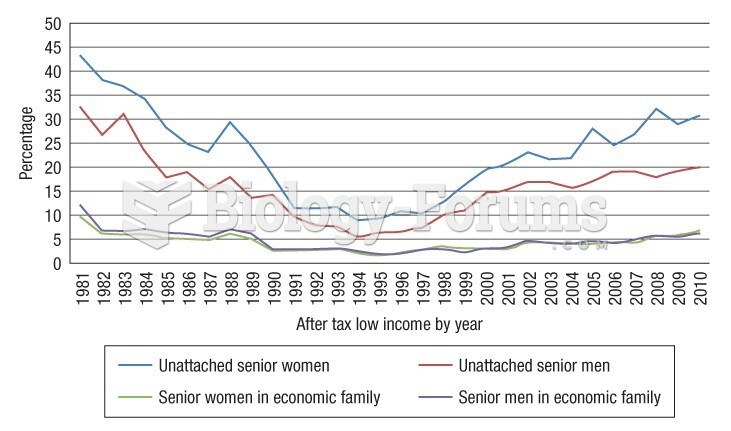 This graph illustrates how unattached older adults are poorer than their peers who live in families
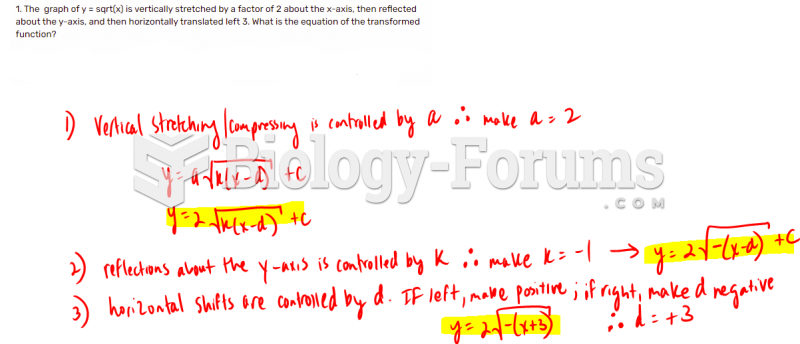 The graph of y = sqrt(x) is vertically stretched by a factor
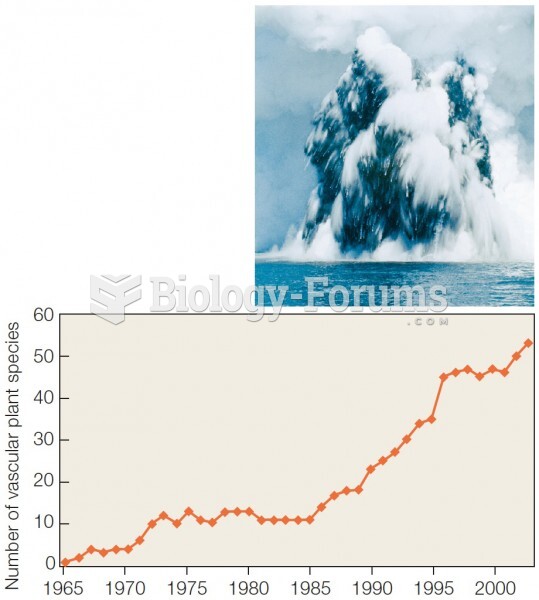 Surtsey, a volcanic island, during the time of its formation.