This topic contains a solution. Click here to go to the answer
|
|
|

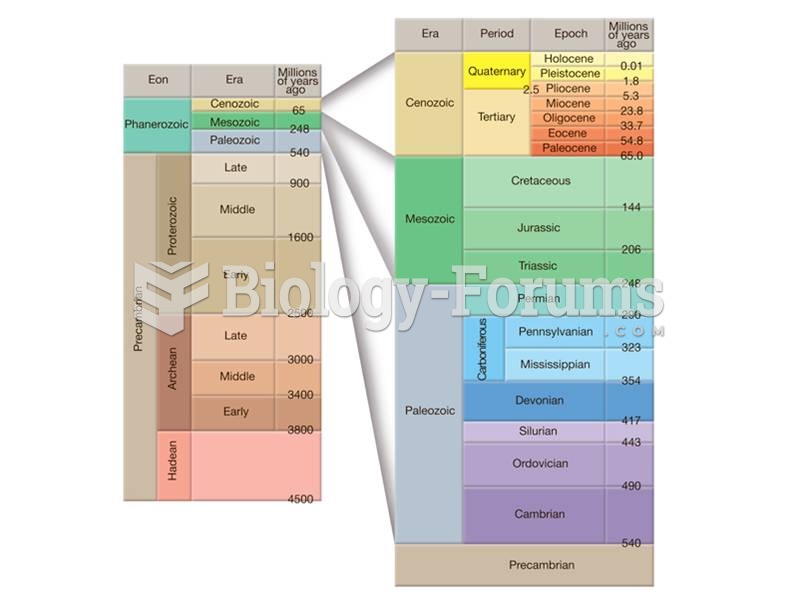 Earth’s history is divided into nested sets of time--eons, eras, periods, and epochs--and is called
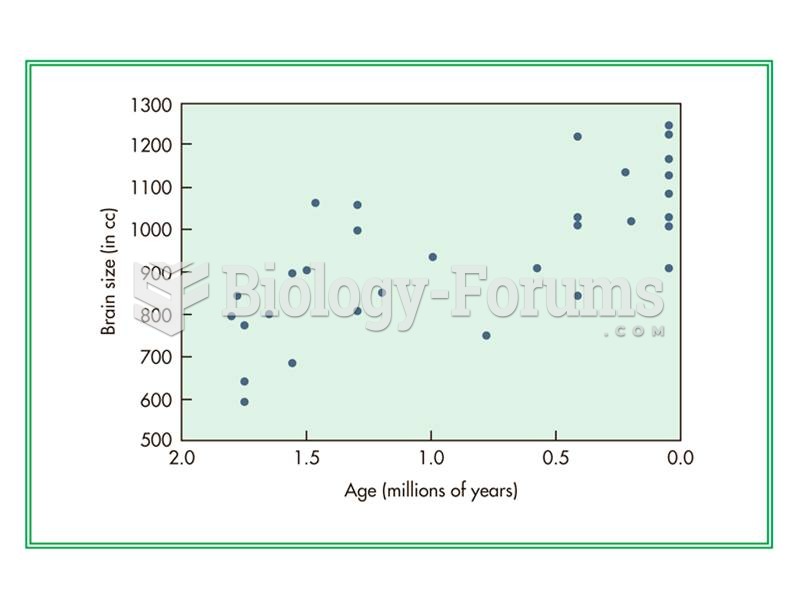 Although average brain size increases gradually though time in H. erectus, individuals with small br
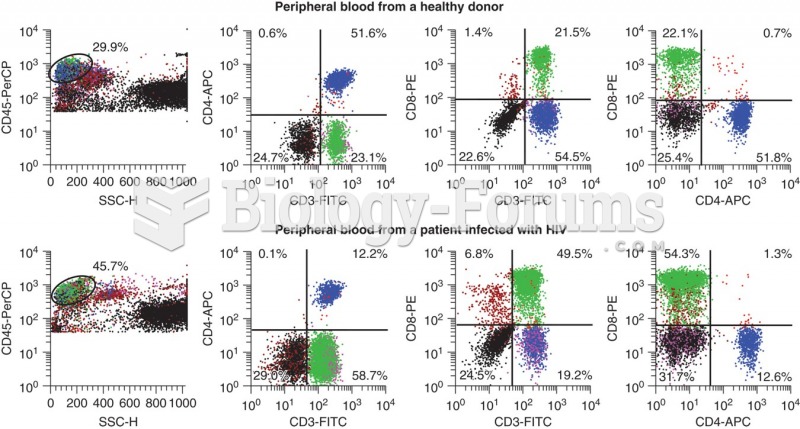 Flow data for a healthy donor (top panel) and a HIV positive patient. CD3 is a T-cell marker, CD4 is ...
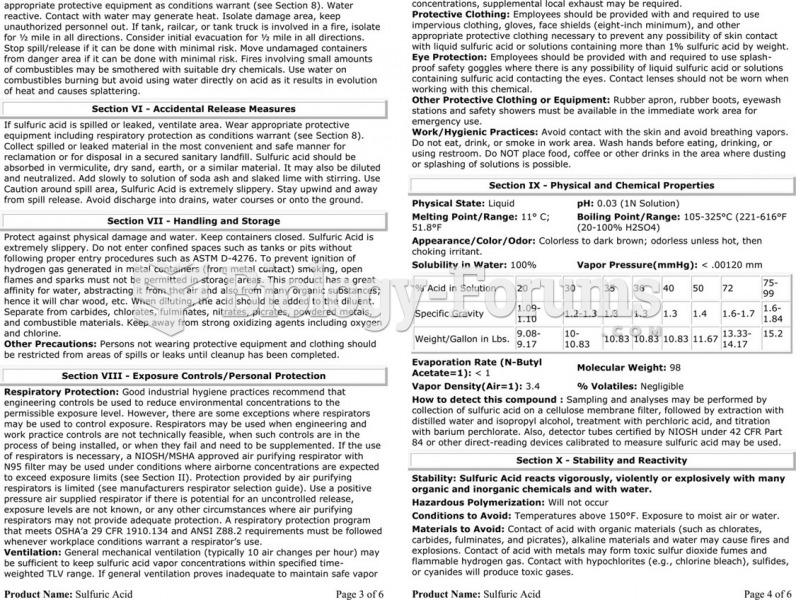 The material safety data sheet (MSDS) for sulfuric acid showing the detailed technical information ...
 Sketch the graph of each function using transformations. State the domain and range.
 Three series of overlapping deletions in the A cistron of the rII locus