This topic contains a solution. Click here to go to the answer
|
|
|

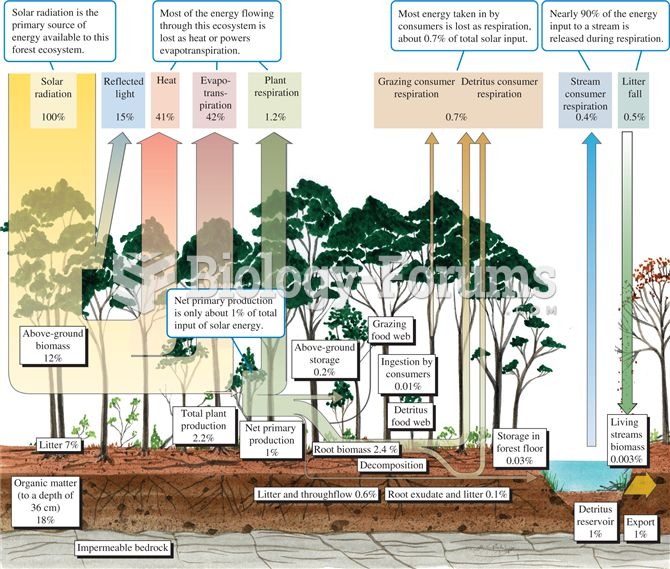 Energy budget for a temperate deciduous forest (data from Gosz et al. 1978).
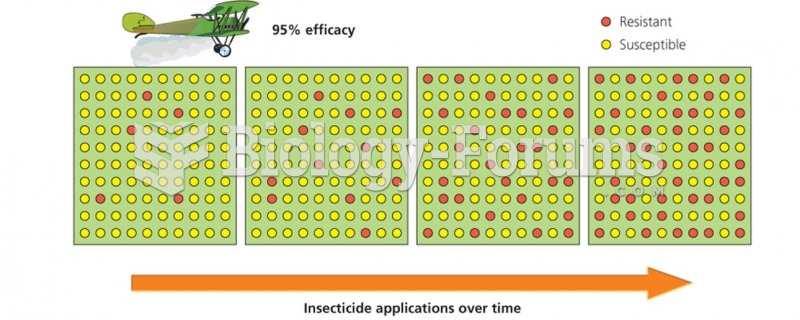 Insecticide application over time
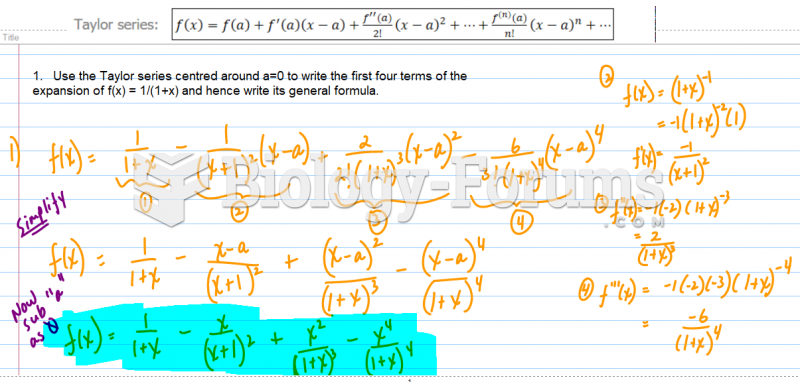 Taylor's Series
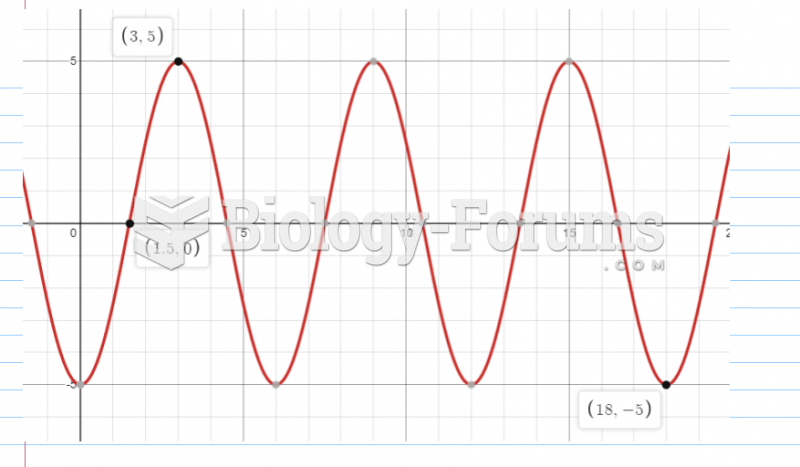 Sketch a graph of the function h(x), by hand on the following interval:
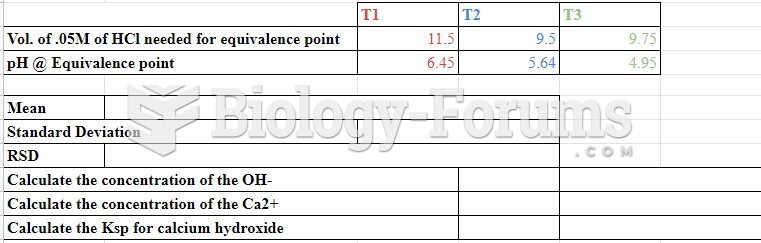 data
data
 Plot of land (Part a)