This topic contains a solution. Click here to go to the answer
|
|
|

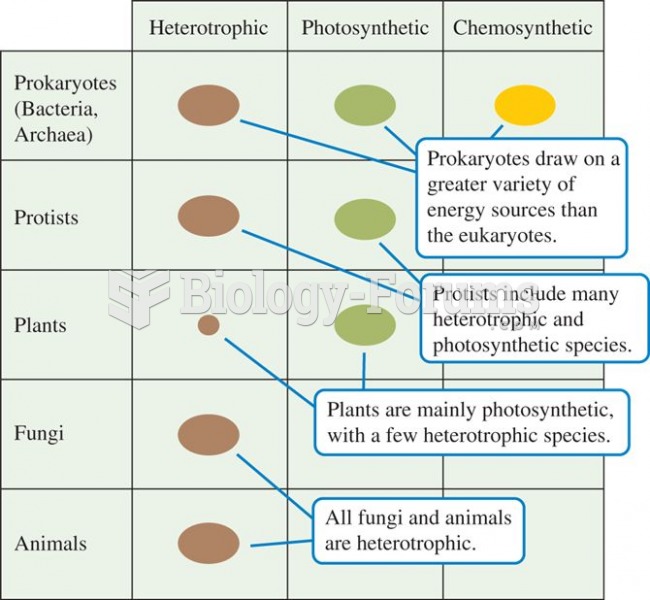 A plot of trophic diversity across the major groups of organisms shows highest trophic diversity amo
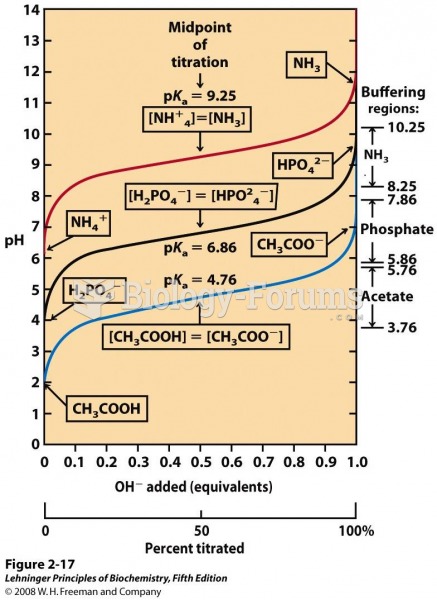 Comparison of the titration curves of three weak acids
 An Oil-dependent World— Supply and Demand Driven
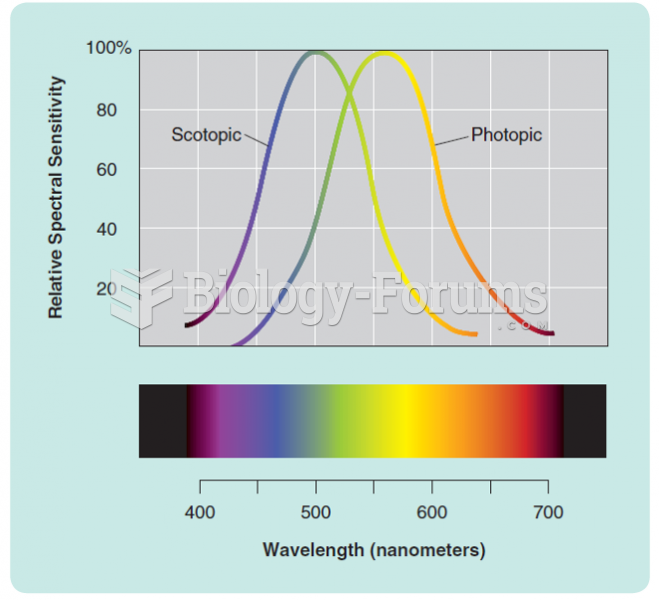 Human photopic (cone) and scotopic (rod) spectral sensitivity curves. The peak of each curve has ...
 Cost of Laptops
![Calculus help: Find the absolute minimum and absolute maximum f(x) = (x2 —1) on [-1.2]](https://biology-forums.com/gallery/44/medium_6_28_02_22_5_37_03.png) Calculus help: Find the absolute minimum and absolute maximum f(x) = (x2 —1) on [-1.2]
Calculus help: Find the absolute minimum and absolute maximum f(x) = (x2 —1) on [-1.2]