A schematic diagram is used to
a. diagram the specific predictions of the research hypothesis.
b. undo the interactions that occurred in an experiment.
c. present the means of the independent variable.
d. describe the research hypothesis in terms of predicted correlations.
Question 2
In a factorial design in which the factors are crossed,
a. each of the factors has more than two levels.
b. each of the factors has a different number of levels.
c. each level of one factor occurs with each level of the other factor.
d. there are more levels than conditions.

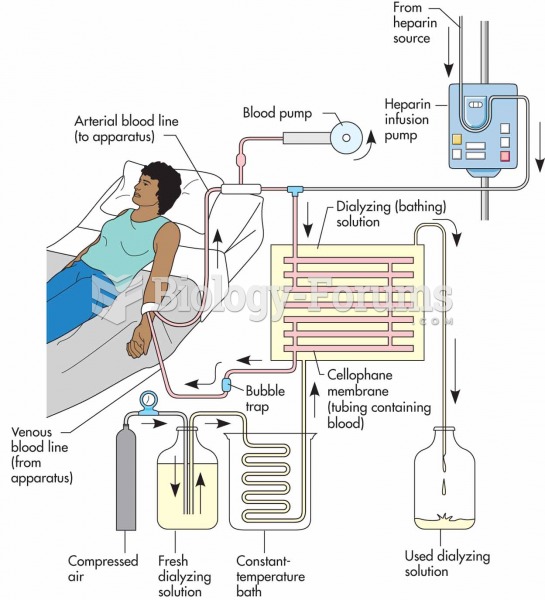 Schematic hemodialysis machine
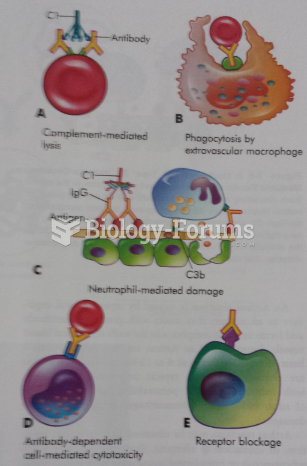 Type II Tissue Specific Reactions
 Distance from Earth to Sun schematic
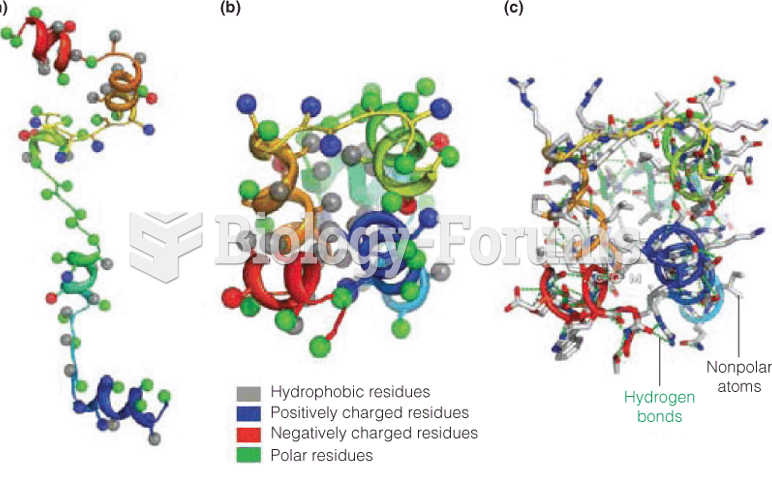 Schematic of de novo structure prediction using Rosetta
 Research that has examined babies' ability to recognize themselves develops in the 2 year
 Morgan’s crossing-over hypothesis