|
|
|

 Drugs and their effect table
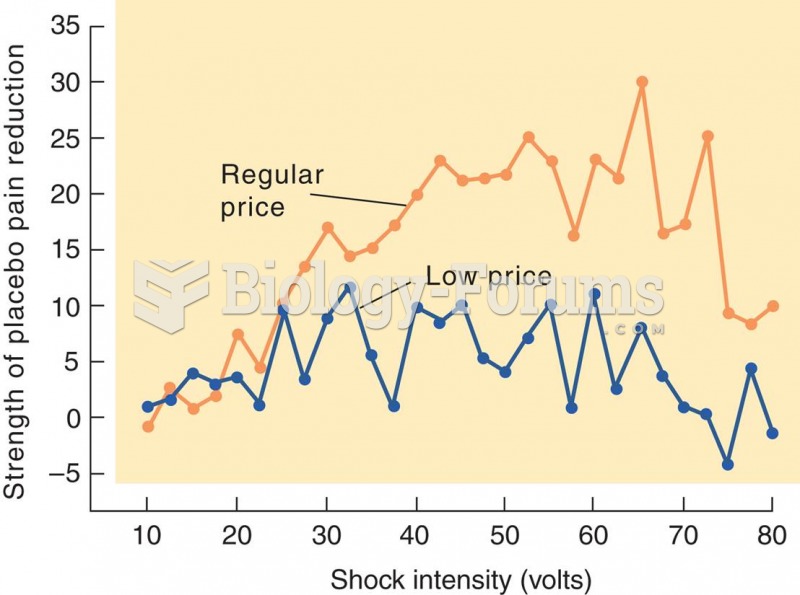 Effect of Perceived Price of a Drug on Placebo Analgesia
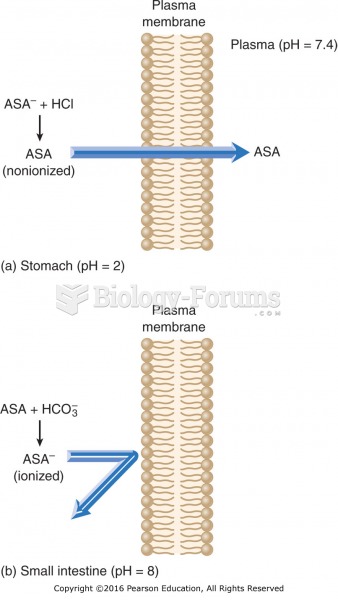 Effect of pH on drug absorption: (a) A weak acid such as aspirin (ASA) is in a nonionized form in an ...
 How to graph quadratic equations that are in factored form y=a(x−r)(x−s)
 Calculation of the probabilities in a mating involving the ABO blood type
 Smoking’s effect on lungs