|
|
|

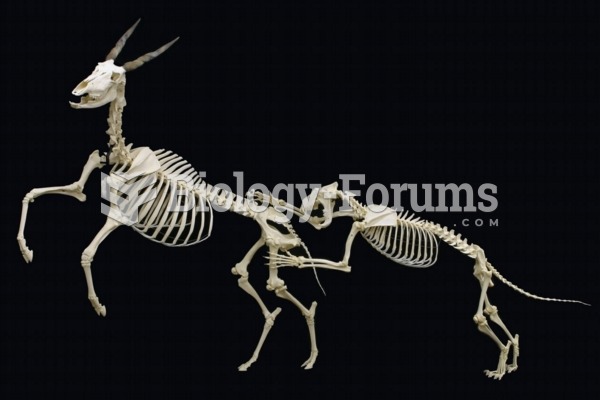 A skeletal mount of an African Lion attacking a Common Eland on display at The Museum of Osteology,
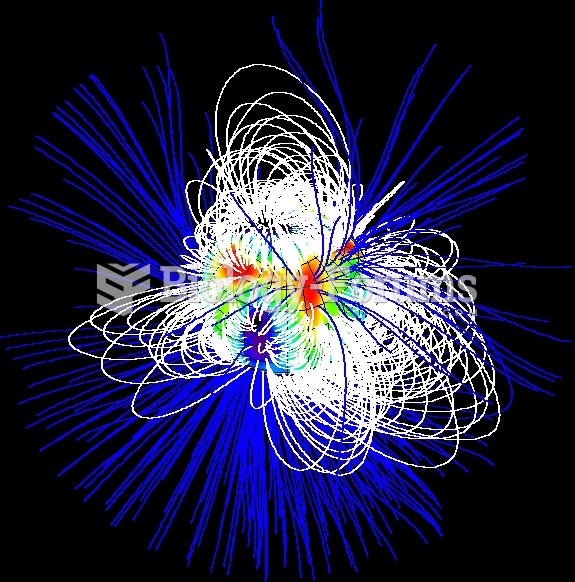 Surface magnetic field of SU Aur (a young star of T Tauri type), reconstructed by means of Zeeman-Do
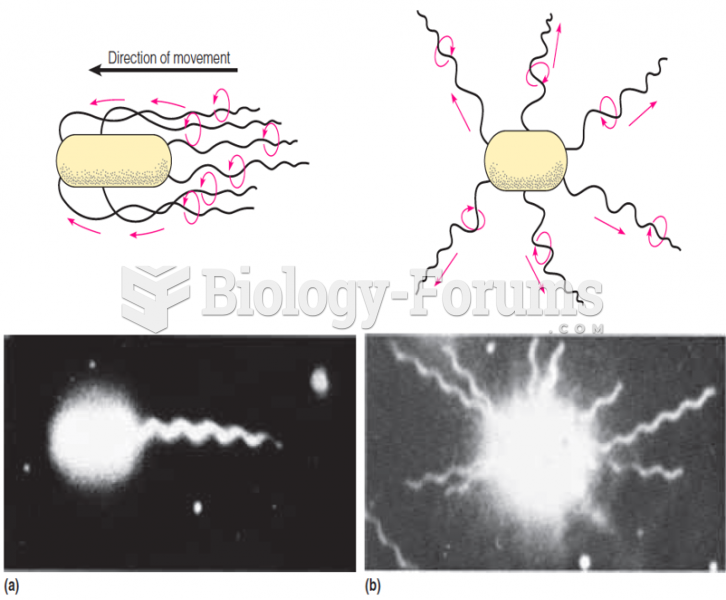 Effect of the direction of flagellar rotation
 The Composition Effect
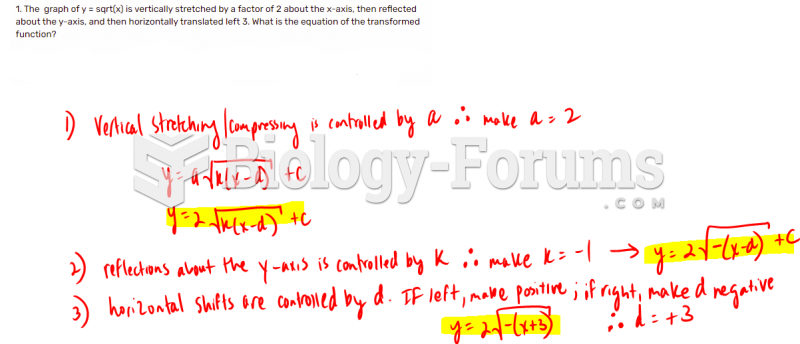 The graph of y = sqrt(x) is vertically stretched by a factor
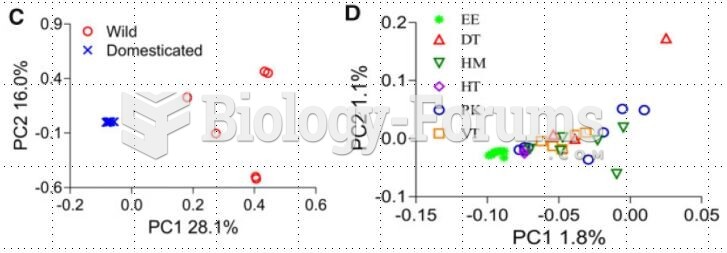 How to interpret these PCA Graph?