|
|
|

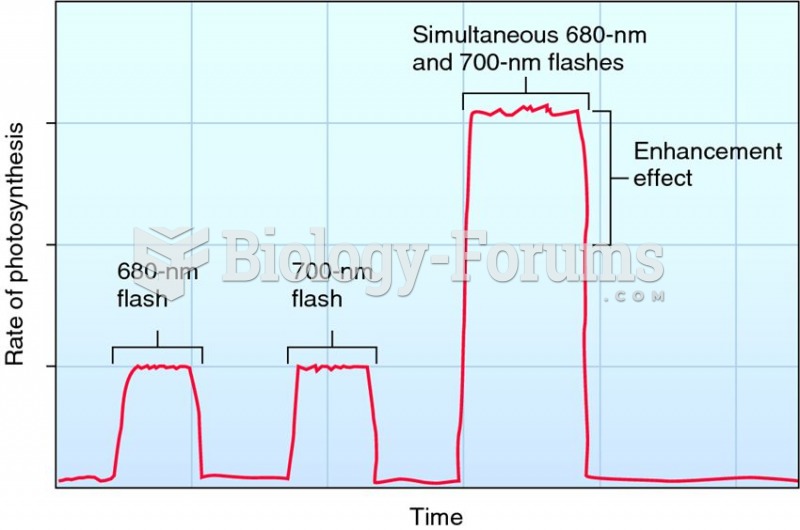 The enhancement effect observed by Emerson.
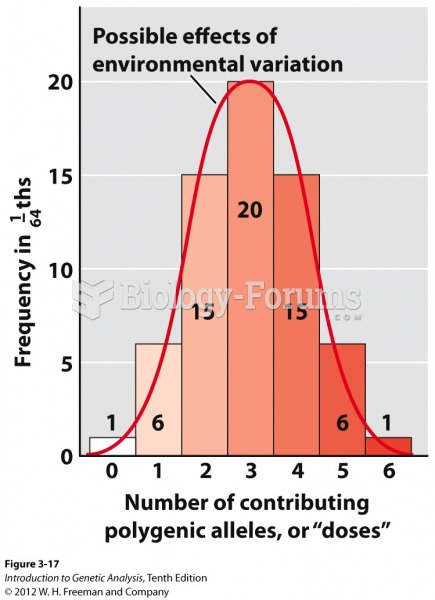 Histogram of polygenes from a trihybrid self
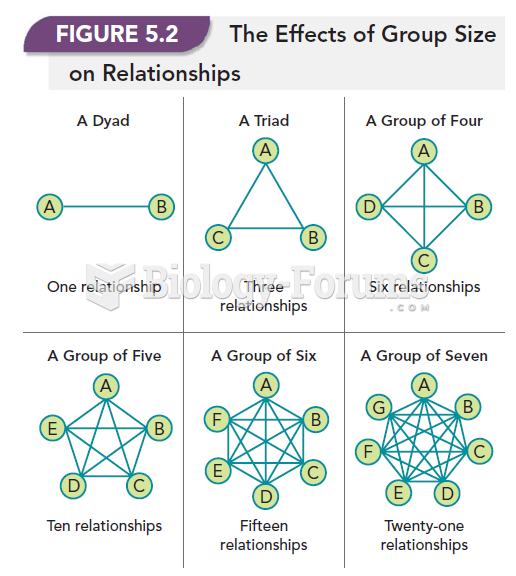 The Effect of Group Size on Relationships
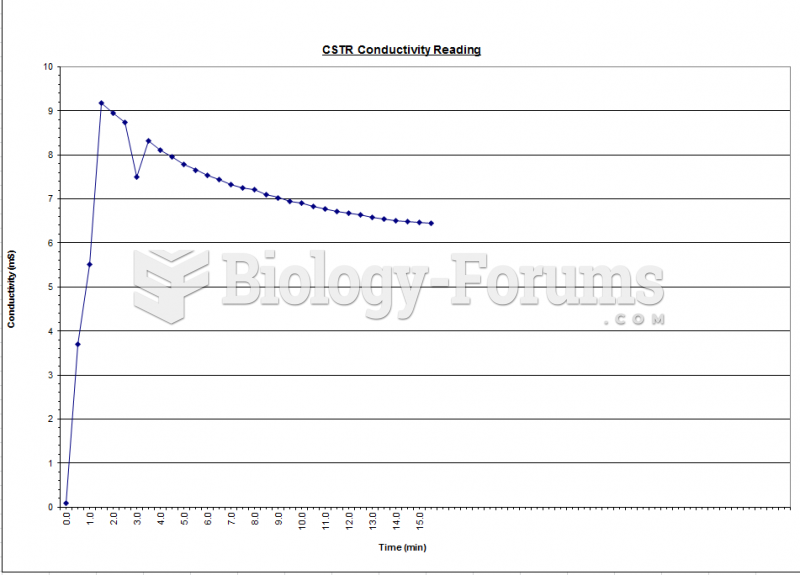 Fluidization - Conductivity Graph
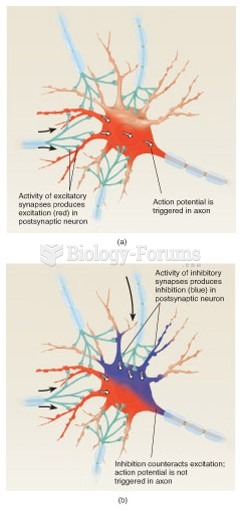 Interaction Between the Effects of Excitatory and Inhibitory Synapses
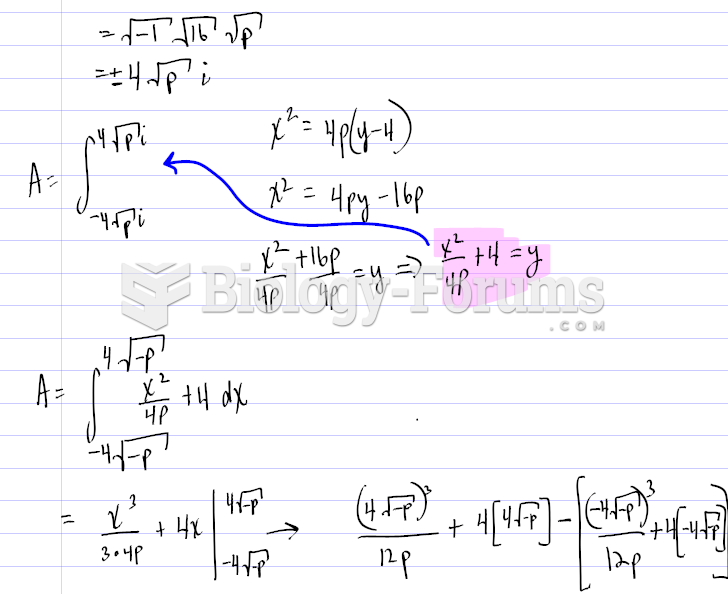 Finding the graph of a Parabola using certain values