This topic contains a solution. Click here to go to the answer
|
|
|

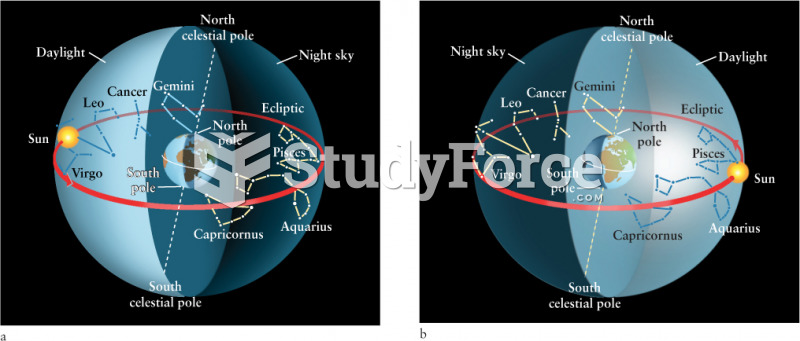 Why Different Constellations Are Visible at Different Times of the Year
 Fuel should be heard returning to the fuel tank at the fuel return line if the fuel pump and ...
 Scientists should use a variety of media to present the message
 Basic Marketing Research: Using Microsoft Excel Data Analysis
 Scientists joke
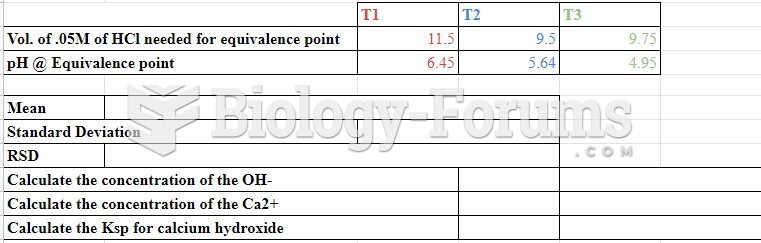 data
data