This topic contains a solution. Click here to go to the answer
|
|
|

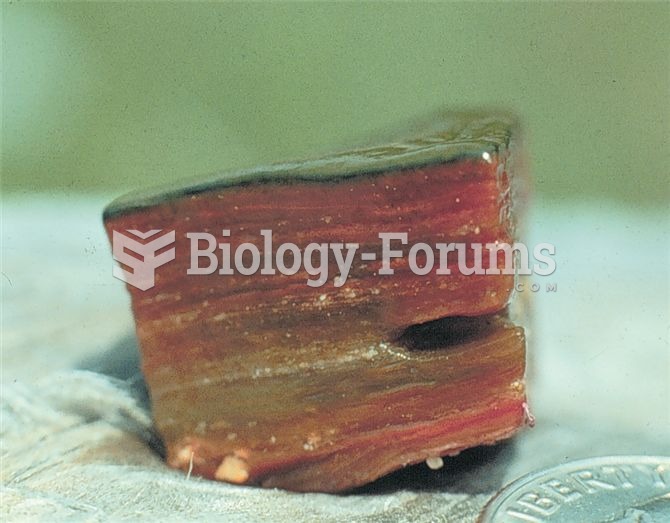 Cyanobacteria of the (a) genus Synechococcus form (b) mats that line hot springs around the world.
 Uranus's aurorae against its equatorial rings, imaged by the Hubble telescope. Unlike the auror
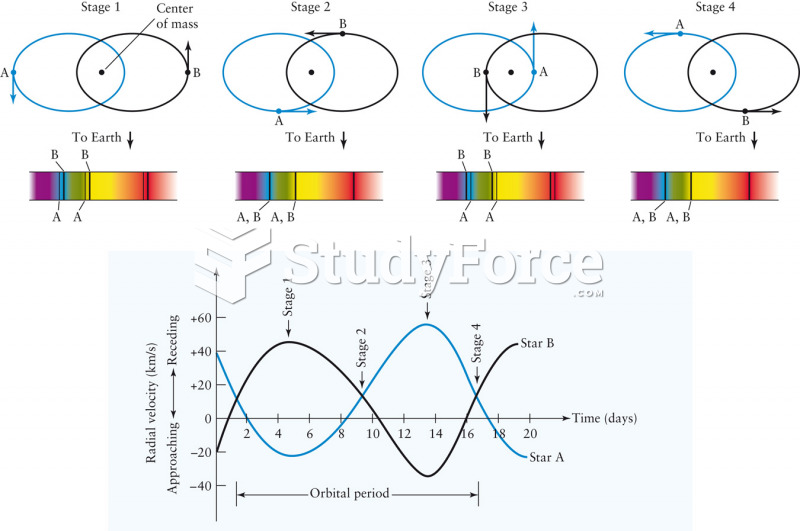 Spectral Line Motion in Binary Star Systems
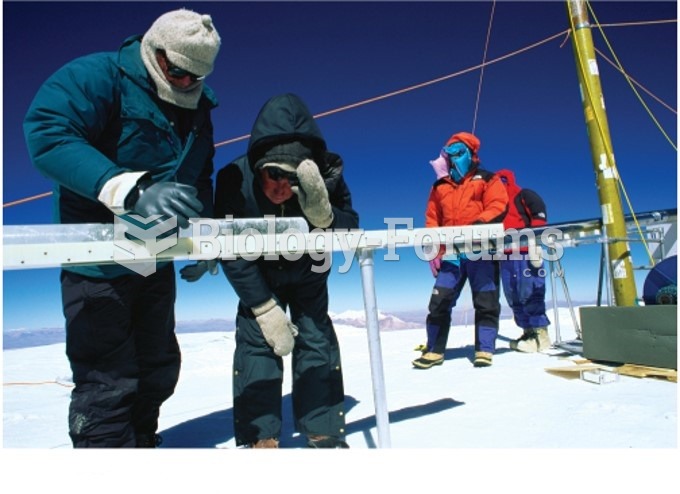 Scientists with ice core
 Ribosome structure and tRNA-binding sites interpreted from cryo-EM–generated data
 Kindergarten school year book