This topic contains a solution. Click here to go to the answer
|
|
|

 Uranus's aurorae against its equatorial rings, imaged by the Hubble telescope. Unlike the auror
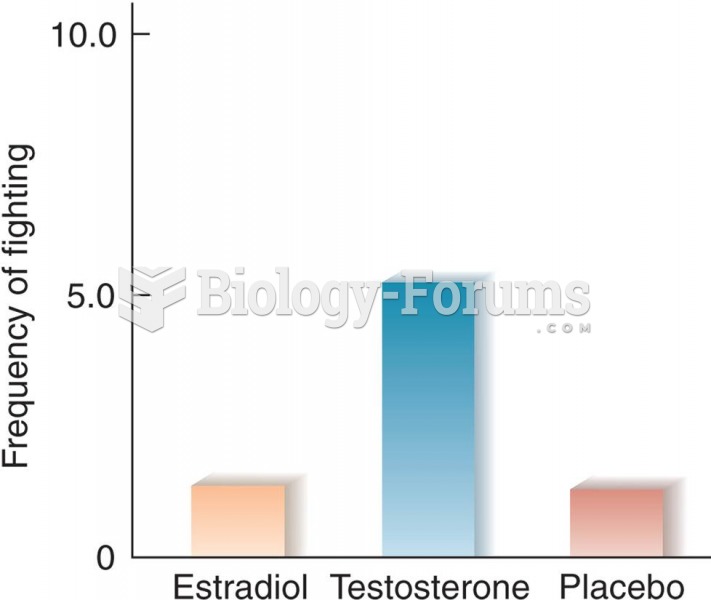 Effects of Estradiol and Testosterone on Interfemale Aggression in Rats (Based on data from van de P
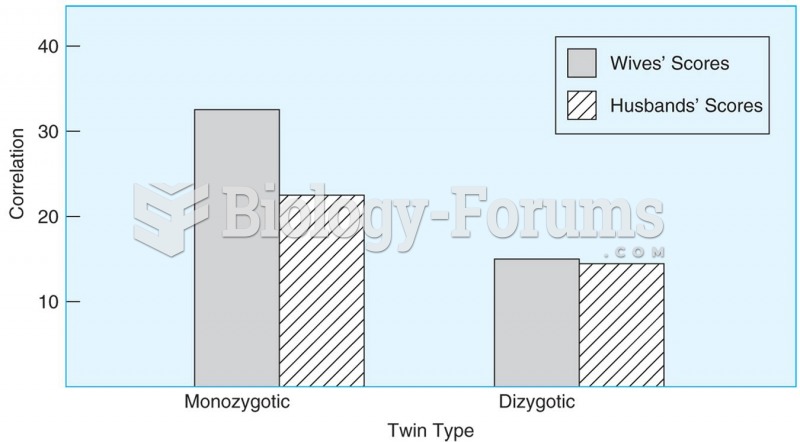 Women who are monozygotic twins and have the same genes are more similar in their marital happiness
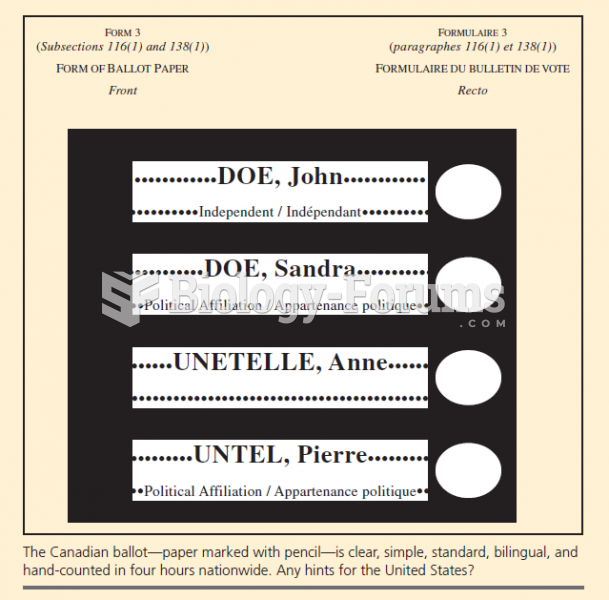 The Canadian ballot is considerably simpler than the American ballot. Note there is nothing like a c
 How to find the equation of a line that is perpendicular to a line passing through a point
 The year 2010 was the hottest since 1880