This topic contains a solution. Click here to go to the answer
|
|
|

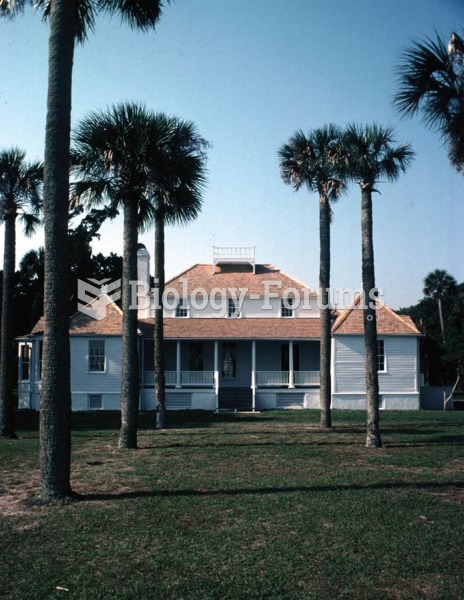 The Kingsley plantation, on Fort George Island in Jacksonville, Florida. Zephaniah Kingsley, the own
 Jewish Scientists
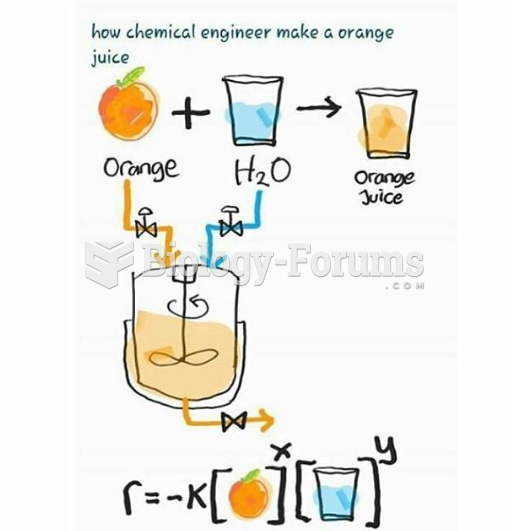 How Chemical Engineer Make a Orange
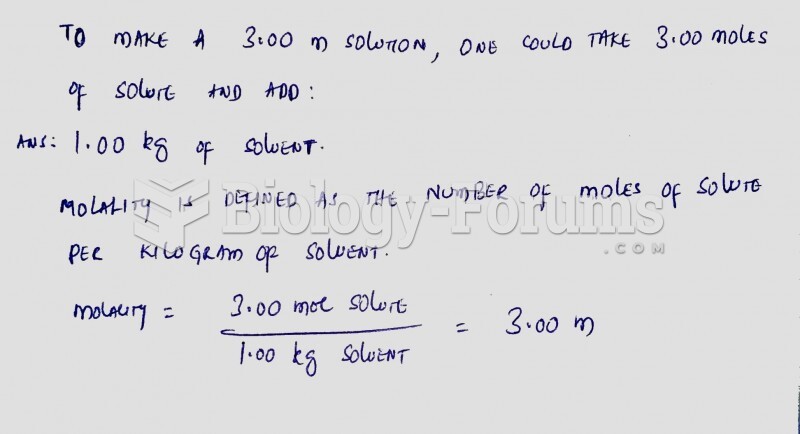 To make a 3.00 m solution, one could take 3.00 moles of solute and add
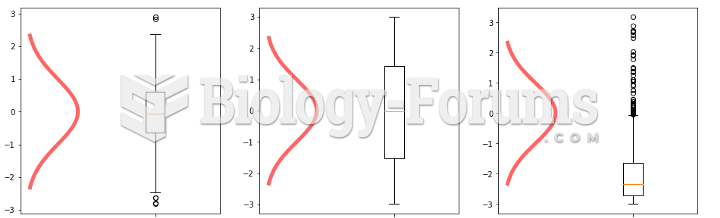 Histograms - Analysis and Data
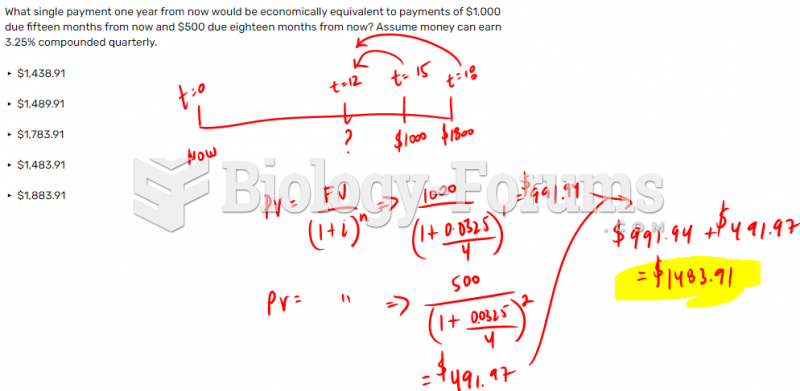 What single payment one year from now would be economically equivalent to payments of $1,000 ...