This topic contains a solution. Click here to go to the answer
|
|
|

 The digital image of a fetus shows a well-developed head and a comparatively smaller body. At 7 ...
 Attention and memory are in demand during circle time.
 This frame from a home video shows Eric Harris (on the left) and Dylan Klebold (on the right) as ...
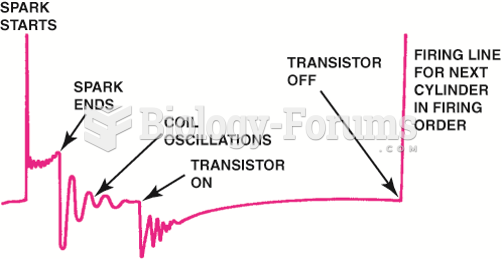 Drawing shows what is occurring electrically at each part of the scope pattern.
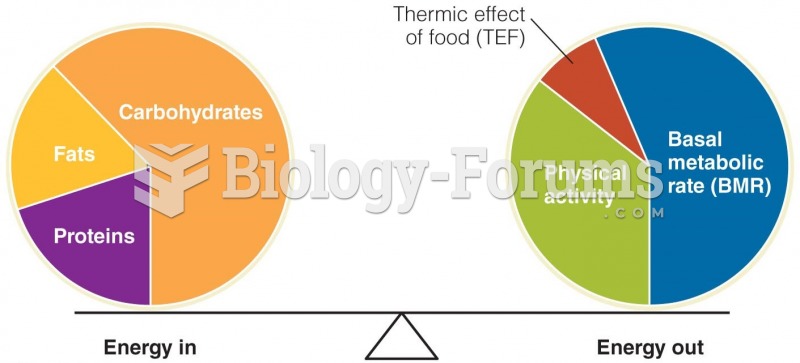 Energy Balance Is Achieved When Energy (Calories) In Equals Energy (Calories) Out
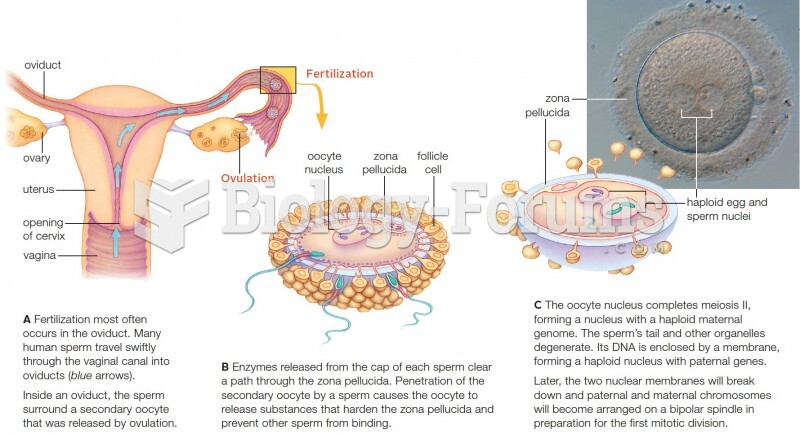 Events in human fertilization. The light micrograph shows a fertilized human oocyte.