This topic contains a solution. Click here to go to the answer
|
|
|

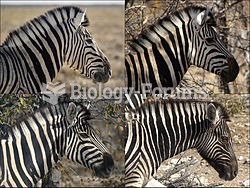 Variation in coat pattern in zebras. The patterns show progressively more black left to right and to
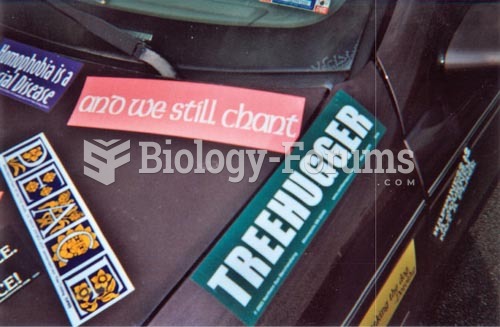 These bumper stickers show an allegiance to New Age religions
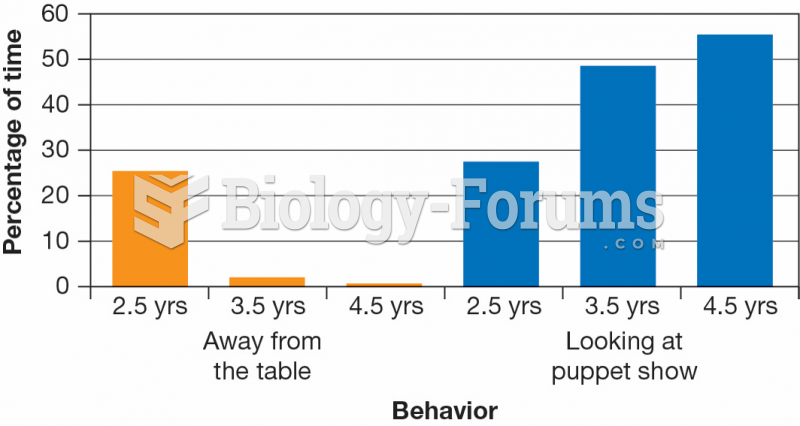 Age Differences in Attention to a Puppet Show Video
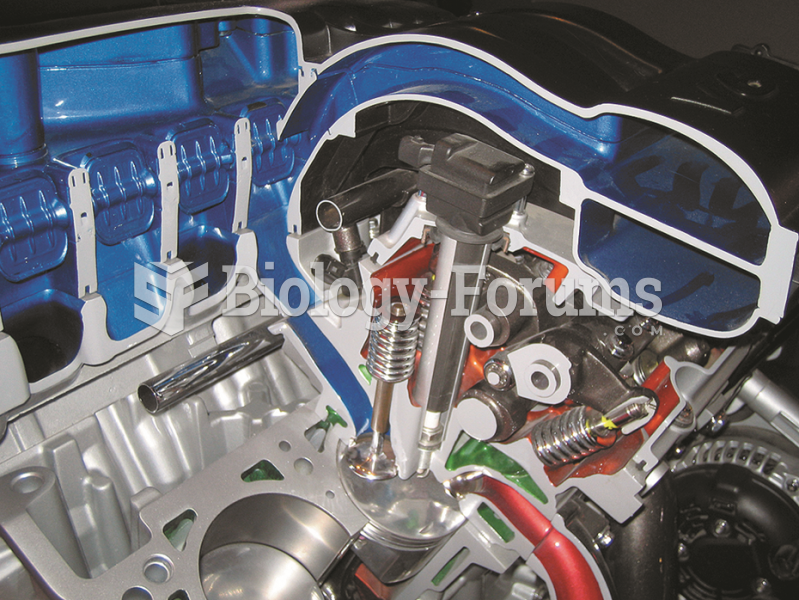 The air flowing into the engine can be directed through long or short runners for best performance ...
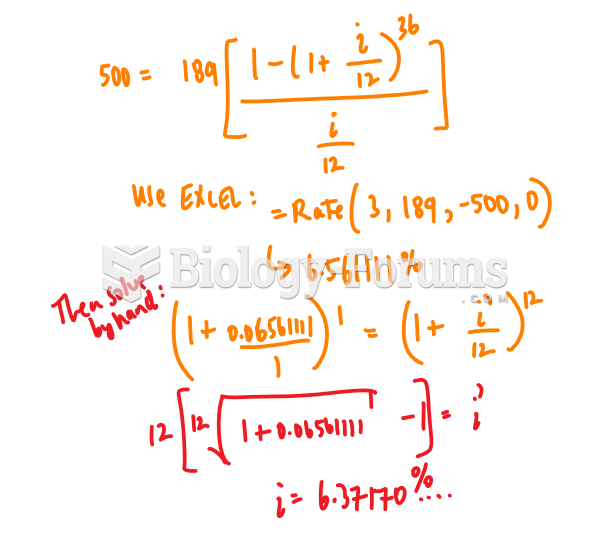 Determine the nominal annual rate of interest of the following ordinary general annuity.
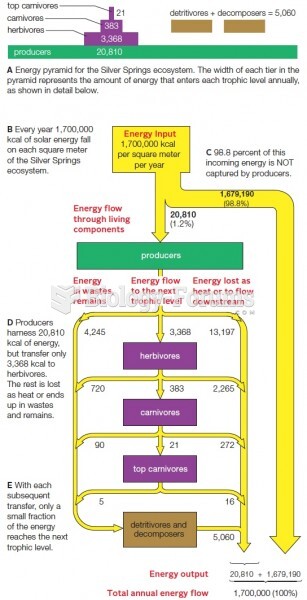 Annual Energy Flow: Silver Springs