This topic contains a solution. Click here to go to the answer
|
|
|

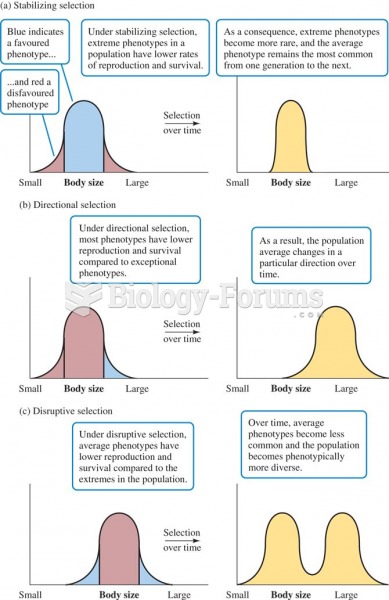 Three principle forms of natural selection: (a) stabilizing selection, (b) directional selection, an
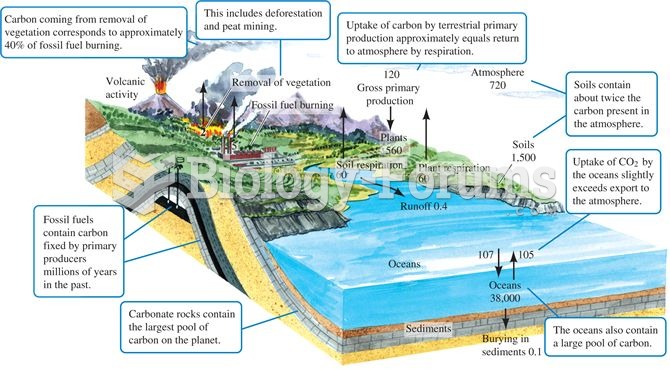 The carbon cycle. Numbers are storage as 1015 g or fluxes as 1015 g per year (data from Schlesinger
 Treatment of Depression with Ketamine The graph shows the effects of ketamine on symptoms of depress
 Blocked at every turn by congressional Republicans who hated him, President Obama turned to techniqu
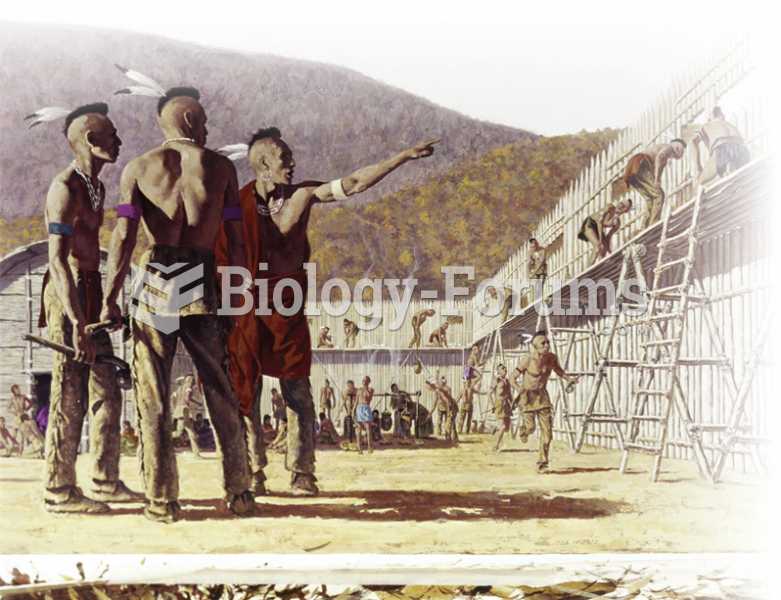 This depiction breaks stereotypes, but is historically accurate. Shown here is an Iroquois fort. Can ...
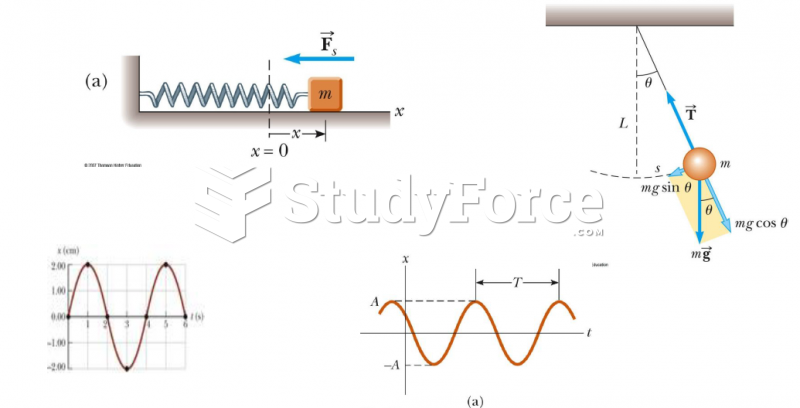 Simple harmonic motion also forms the basis for understanding mechanical waves