|
|
|

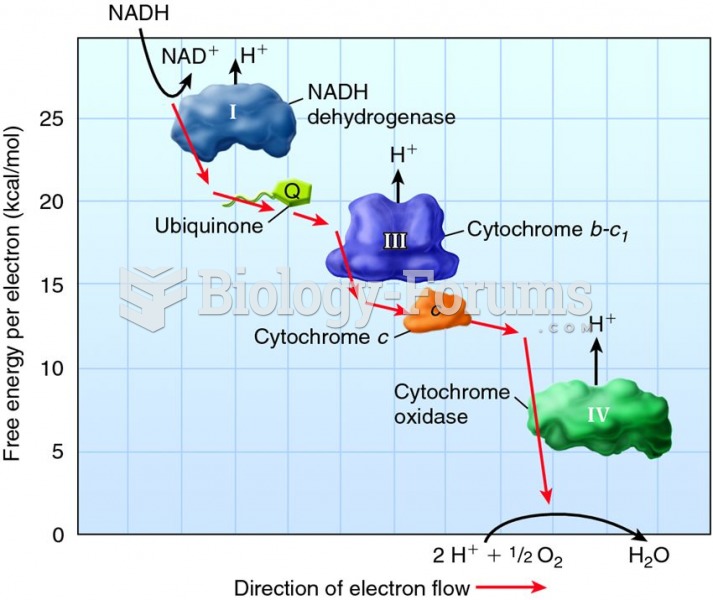 The relationship between free energy and electron movement along the electron transport chain
 Young adults usually grieve loss of a role, such as employment or the breakup of a relationship.
 blank brain diagram
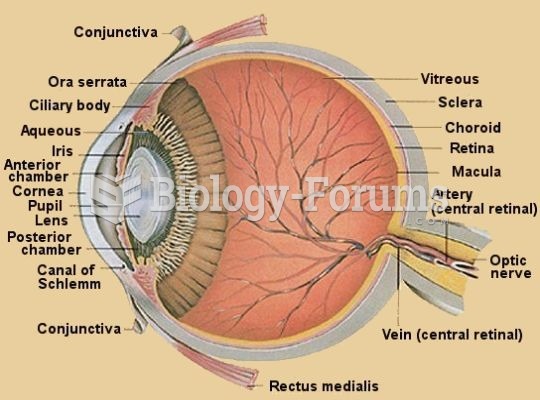 anatomy diagram
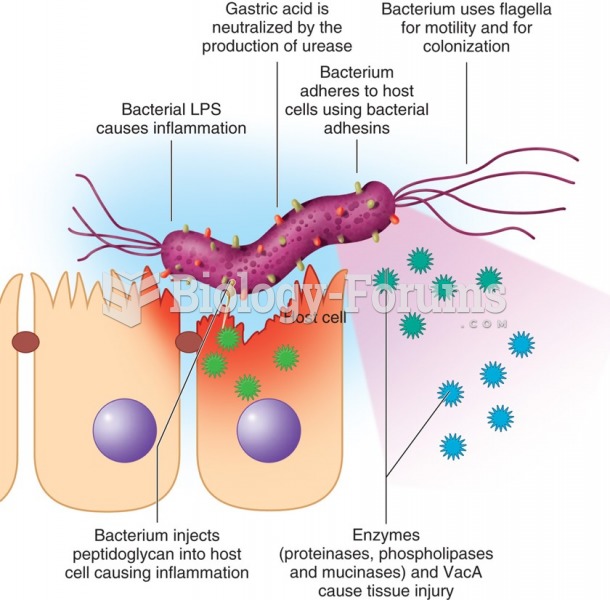 Schematic diagram of virulence factors of Helicobacter pylori.
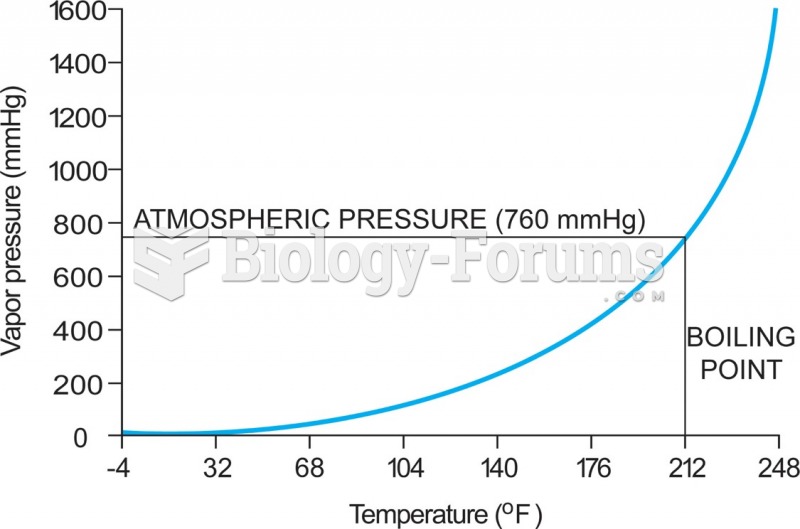 5-4 The relationship between vapor pressure and temperature—in this case for water. As the ...