|
|
|

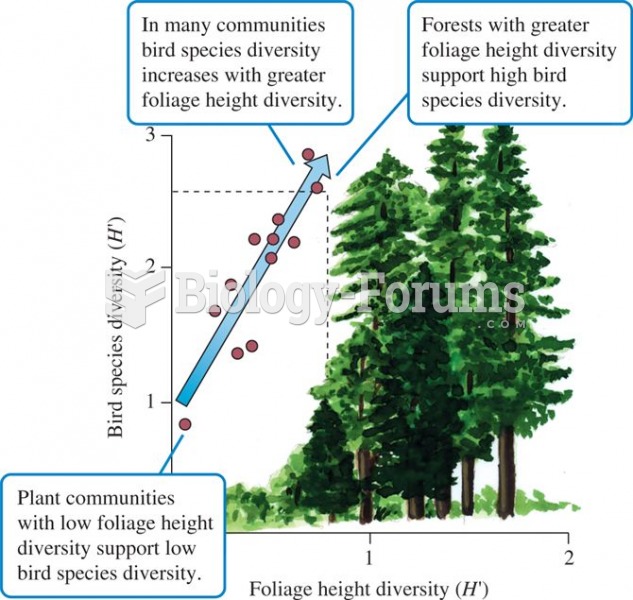 Foliage height diversity and bird species diversity (data from MacArthur and MacArthur 1961).
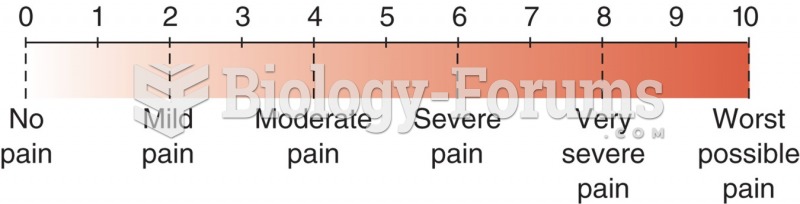 Numerical pain level chart with word modifiers.
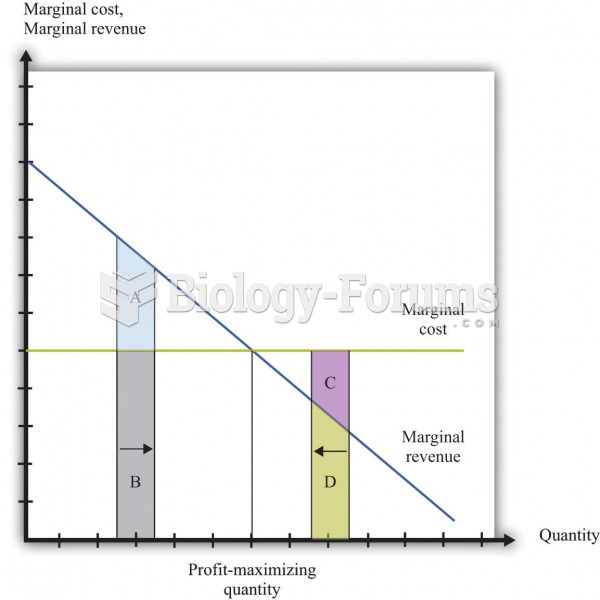 Profit-maximizing Chart
 Data Used to Analyze Productivity in Country 1 and Country 2
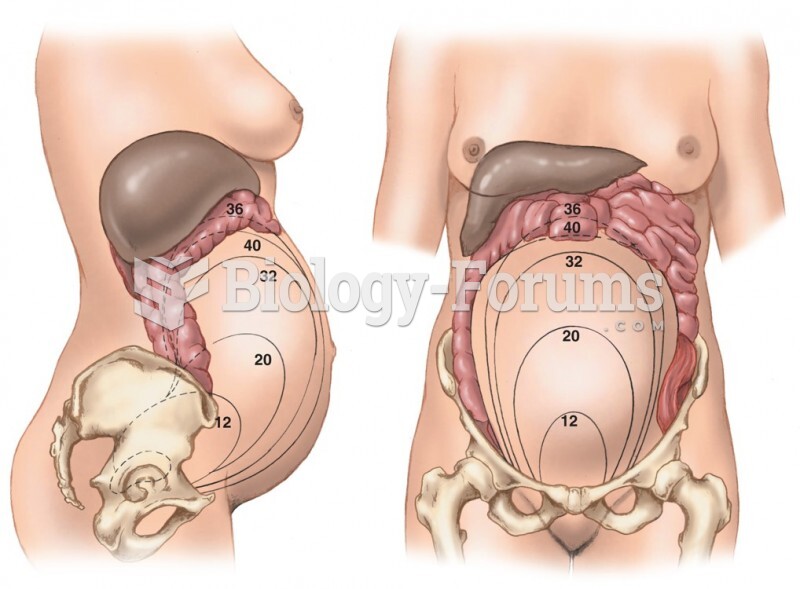 Changing Dimensions of the Pregnant Uterus. Numbers Represent Weeks of Gestation
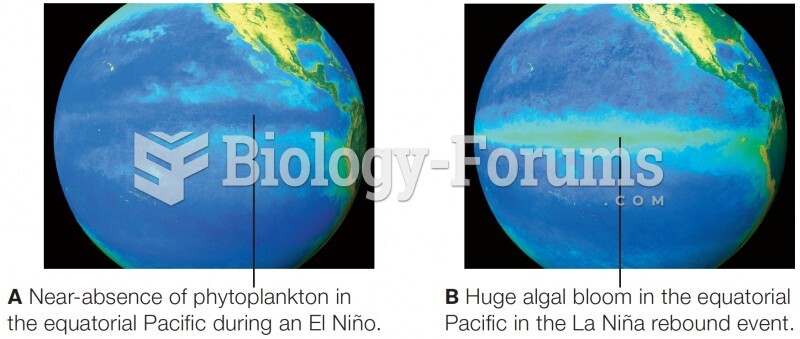 Satellite data on primary productivity in the equatorial Pacific Ocean