|
|
|

 Thyroid scan. The right image is the data from a thyroid scan, printed on a superimposed map of the
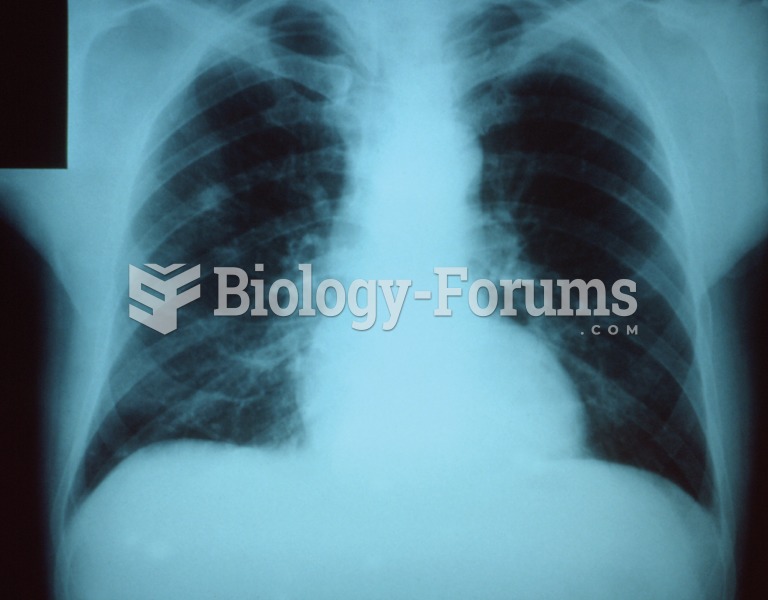 Pneumonia. This common lung inflammation may be caused by bacteria, viruses, or fungi and is often d
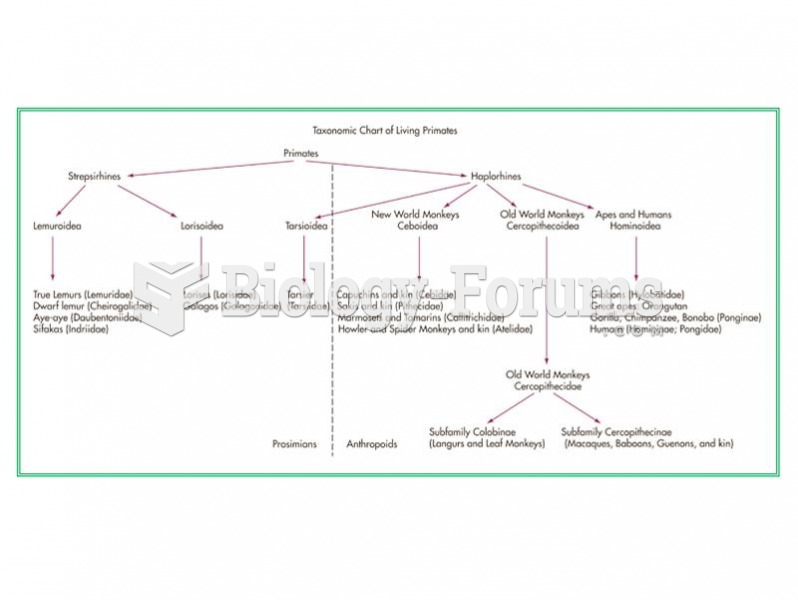 A taxonomic chart of the living primates.
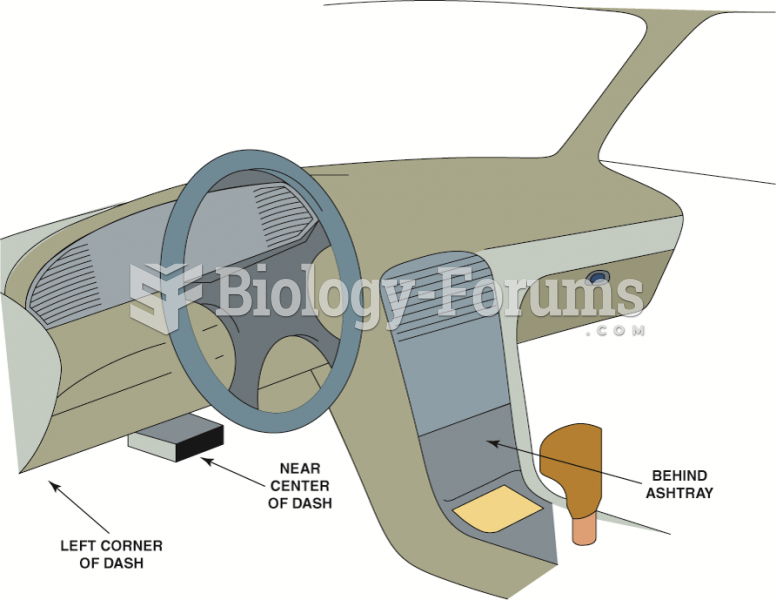 The data link connector (DLC) can be located in various locations.
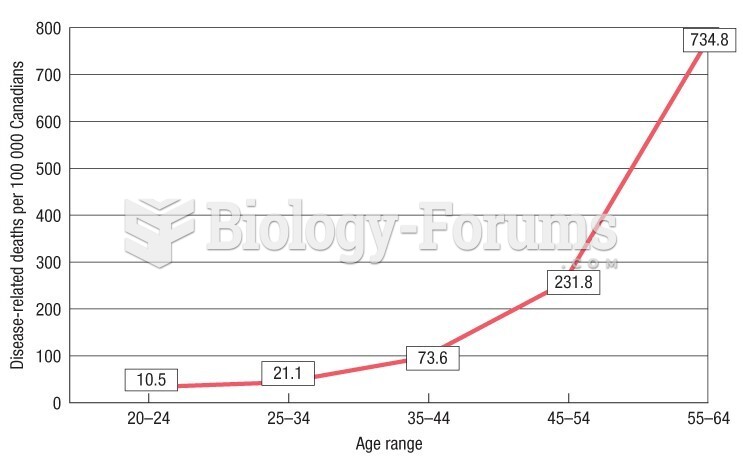 In Canada, disease-related deaths become increasingly common during middle adulthood
 Manhattan plots resulting from a genome-wide association study of seven common human disease