|
|
|

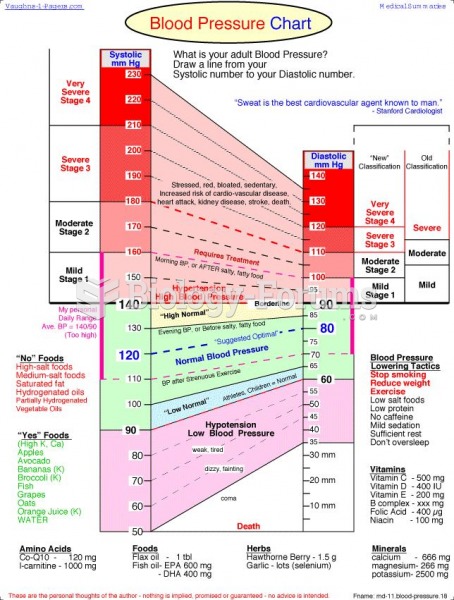 Blood Pressure Chart
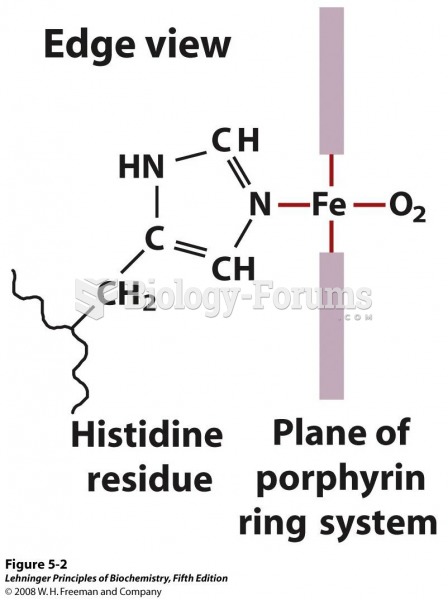 The heme group viewed from the side. This view shows the two coordination bonds to Fe2+
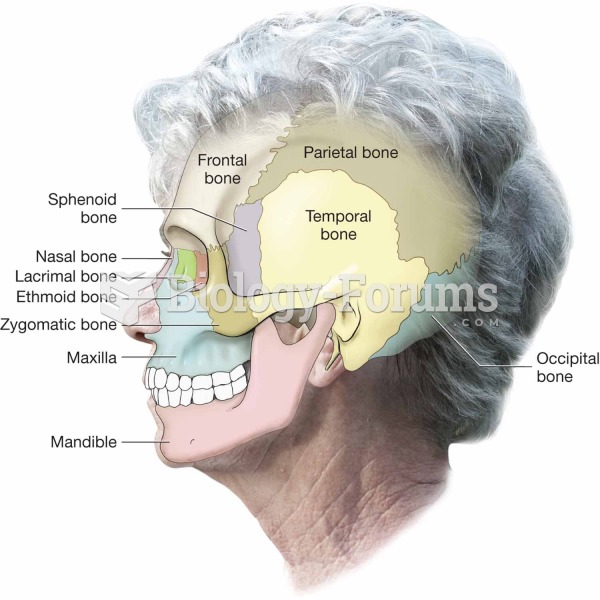 Side view of the cranium and facial bones.
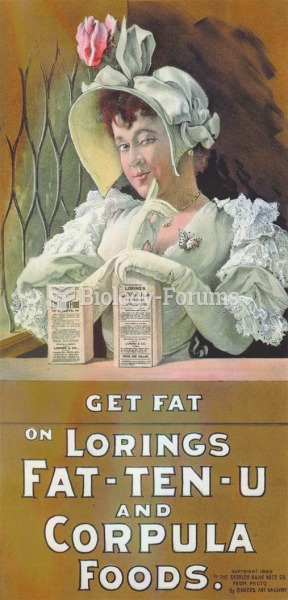 Early in the twentieth century, when malnutrition was common, companies such as this one advertised
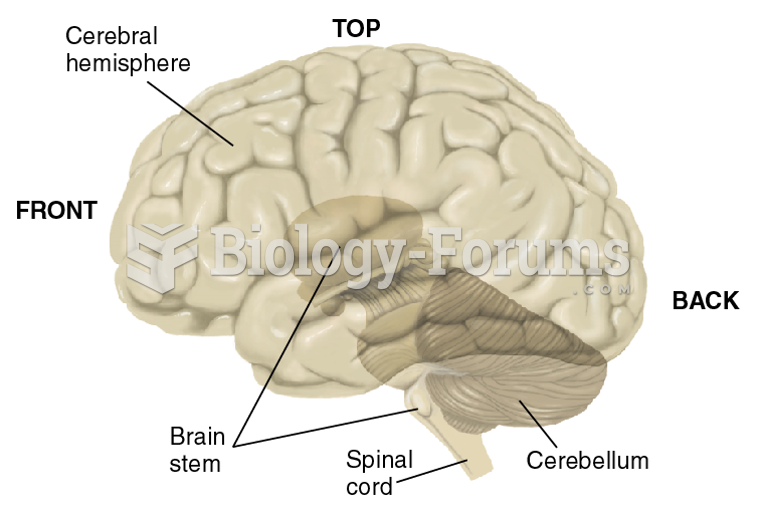 A View of the Left Side of the Brain
 Data for a Hypothetical Paternity Test Using 13 CODIS Genes