|
|
|

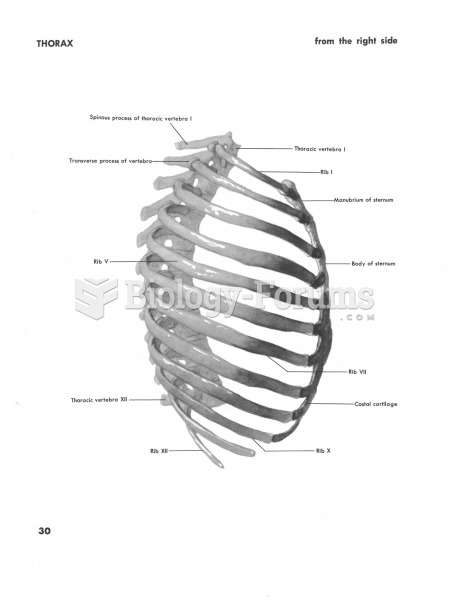 Thorax side
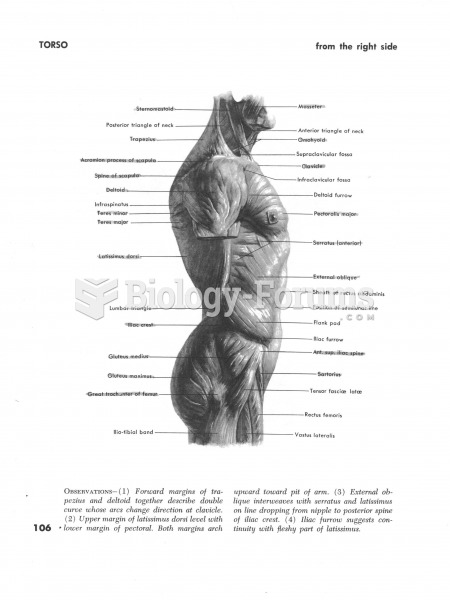 Muscles of the Torso Side
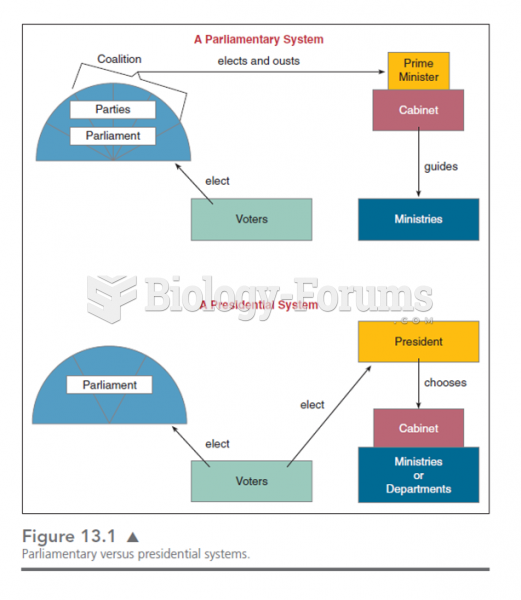 This chart shows the various lines of responsibility and how they differ in presidential and parliam
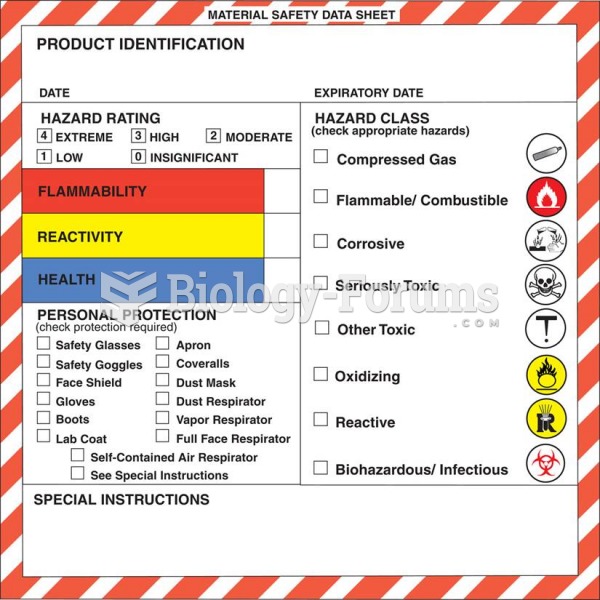 An example of a Material Safety Data Sheet (MSDS).
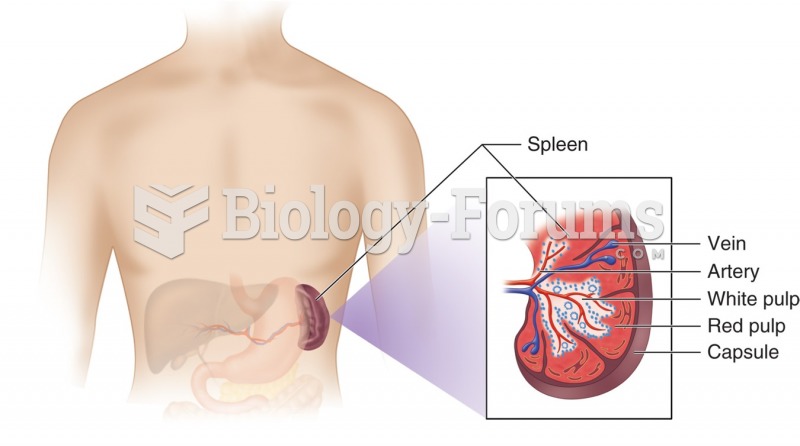 The spleen. Upper left side behide stomach
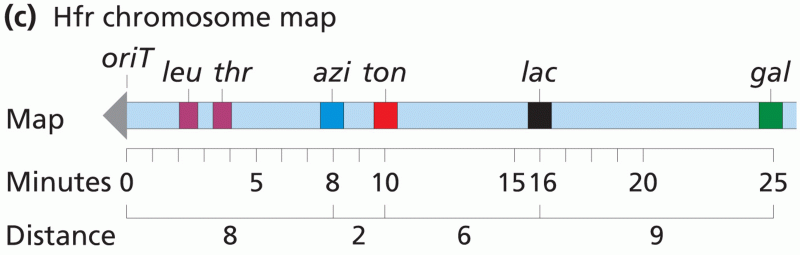 The Hfr chromosome time-of-entry map is assembled from the recombinant data