|
|
|

 Pocket gophers and ecosystem structure (data from Huntly and Inouye 1988).
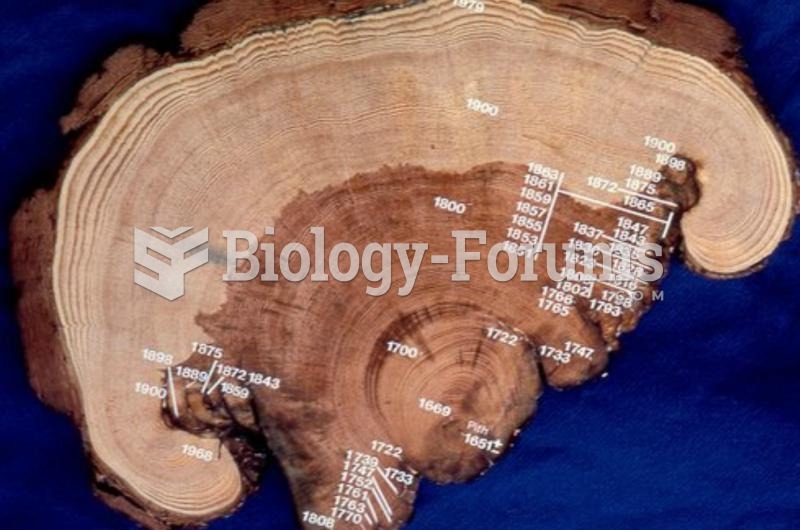 tree-ring data
 Warning stamped on the side of a punch that goggles should be worn when using this tool. Always ...
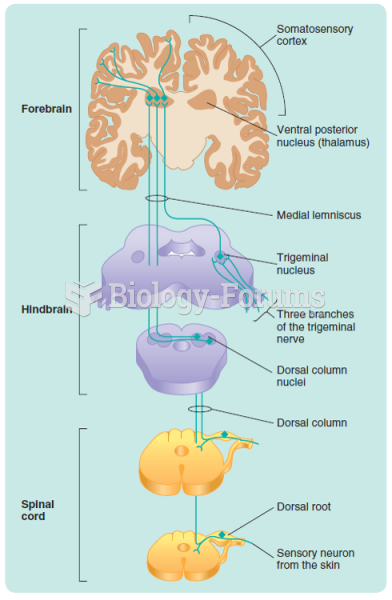 The dorsal-column medial-lemniscus system. The pathways from only one side of the body are shown.
 Business Intelligence, Analytics, and Data Science: A Managerial Perspective, 4th Edition
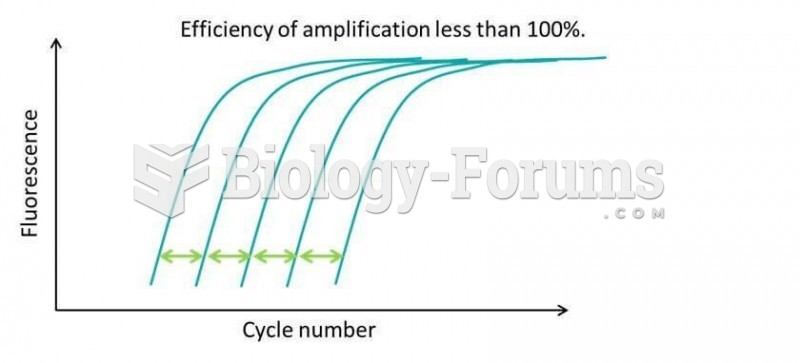 qPCR Efficiency Chart