|
|
|

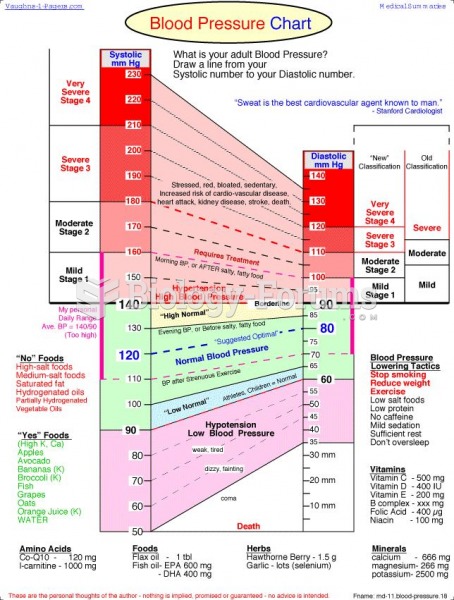 Blood Pressure Chart
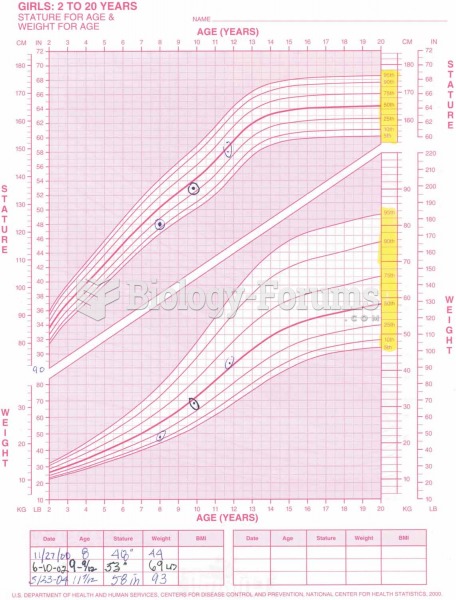 Pediatric growth chart.
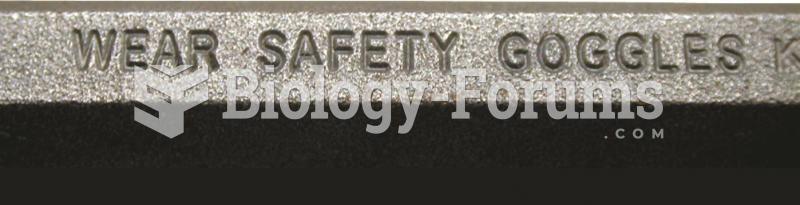 Warning stamped on the side of a punch that goggles should be worn when using this tool. Always ...
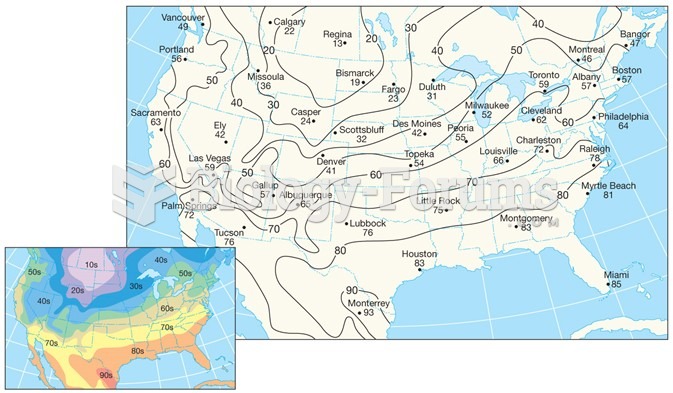 Air-Temperature Data
 Clear the inguinal catchment area. Face the side of the table at recipient’s waist. Place your ...
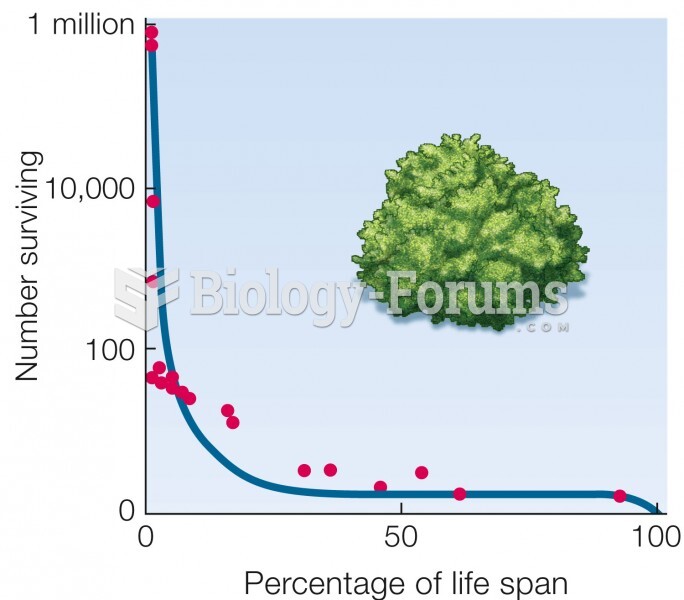 Type III curve. Mortality is highest early in life. Data for a desert shrub (Cleome droserifolia).