|
|
|

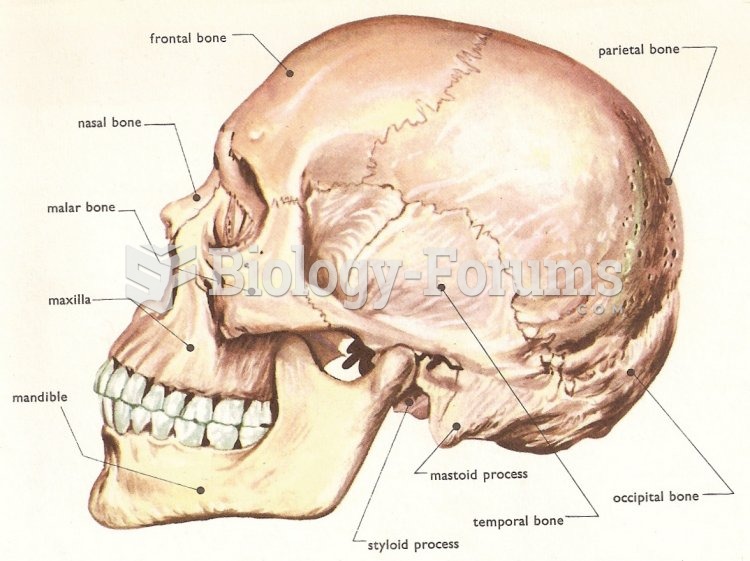 skull side 2
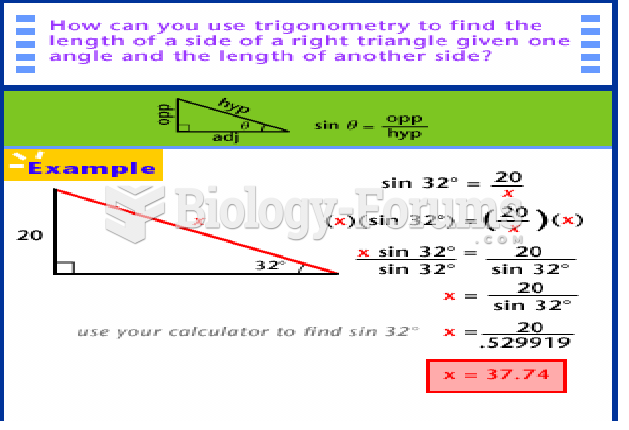 Finding an unknown side of a triangle
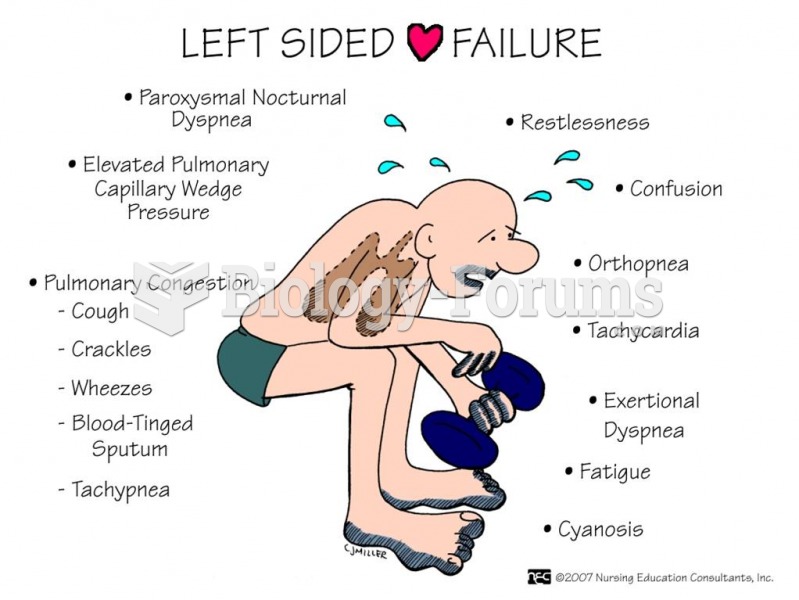 Heart Failure Left side
 Stretching the hip flexors with the recipient side-lying.
 Side-lying position and bolstering for pregnancy massage.
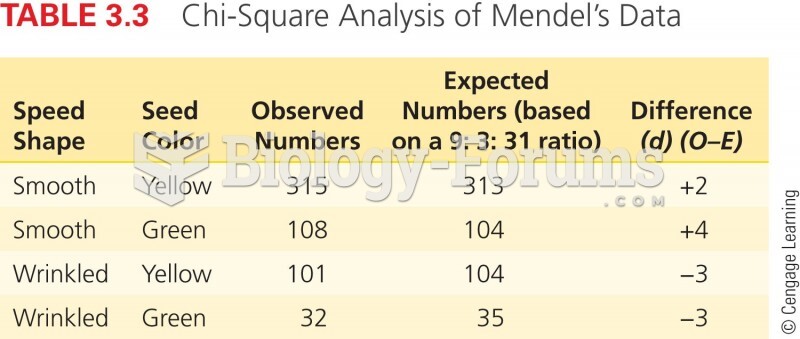 Chi-Square Analysis of Mendel's Data