This topic contains a solution. Click here to go to the answer
|
|
|

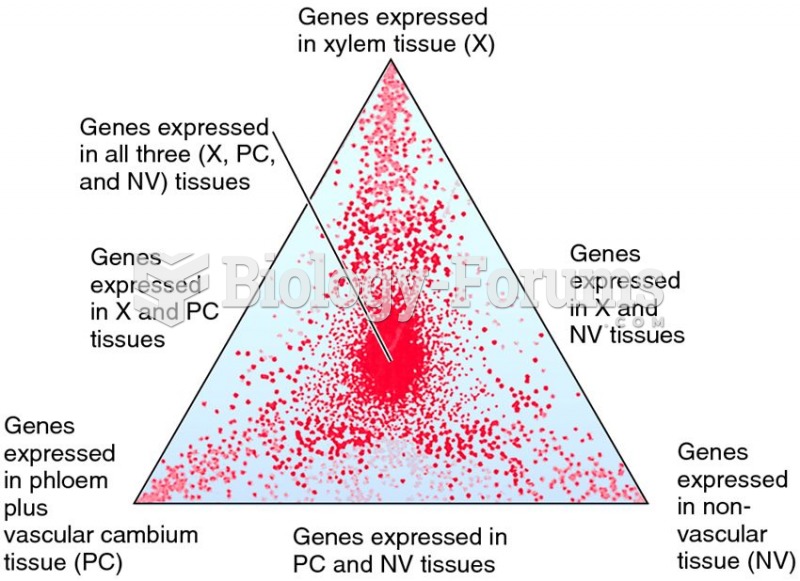 Triangle plot showing gene expression related to xylem, phloem, and nonvascular tissue in Arabidopsi
 Student Raises Hand in Class
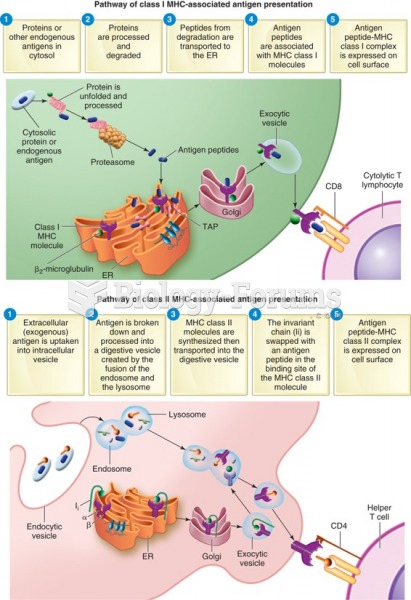 Differences in the antigen-processing pathways between MHC molecules class I and class II.
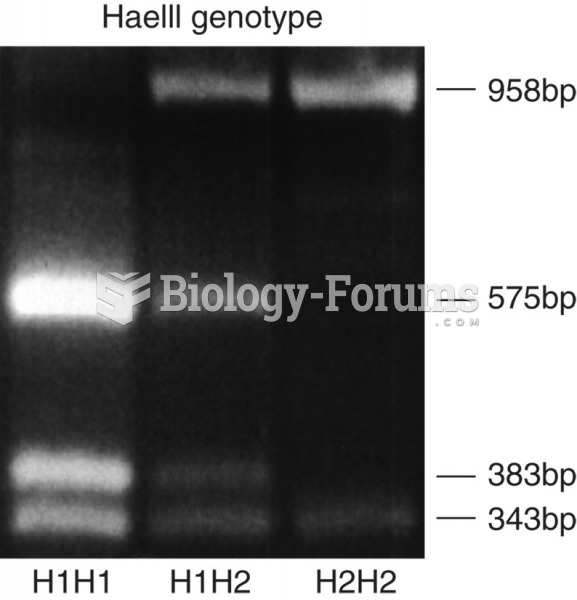 Restriction fragment-length polymorphisms showing different HaeIII genotypes in the b-fibrinogen ...
 Hands-on class in a massage therapy program.
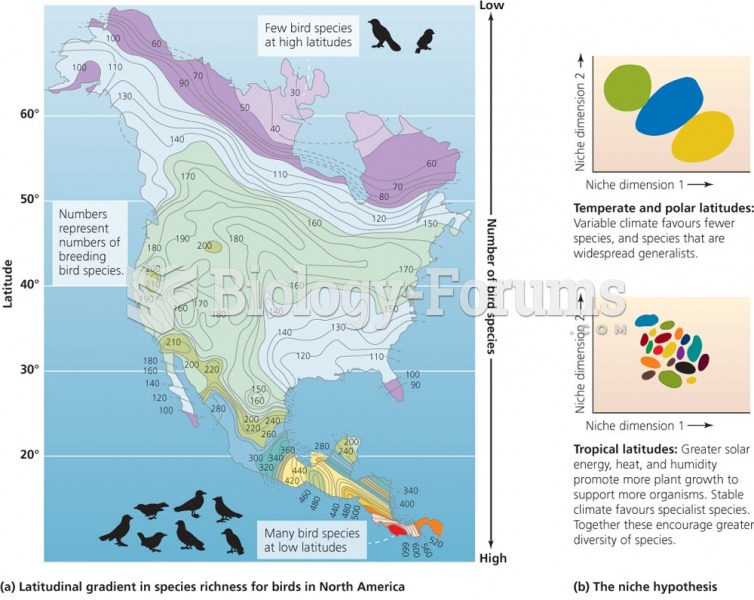 Biodiversity and the unevenly distribution on the planet