This topic contains a solution. Click here to go to the answer
|
|
|

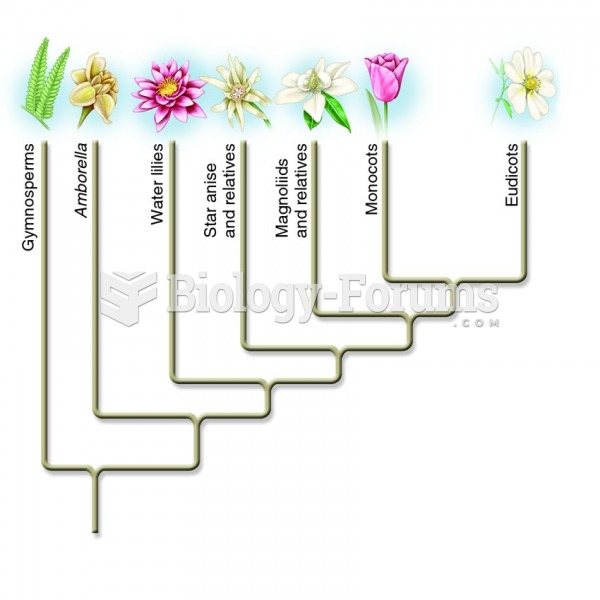 A phylogeny showing the major modern angiosperm lineages
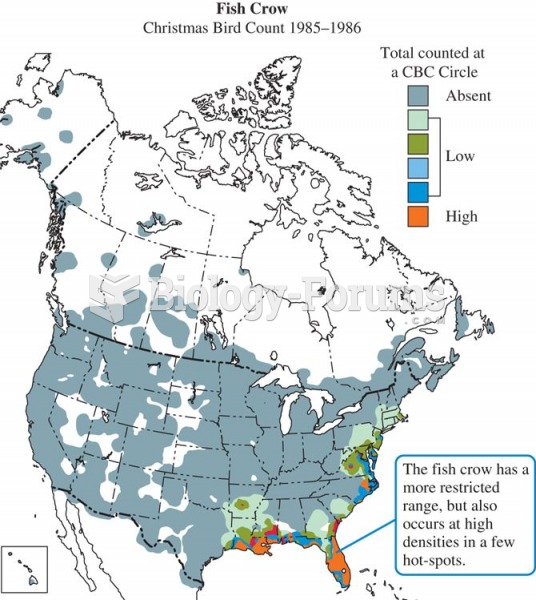 Winter distribution of the American crow, Corvus brachyrynchos.
 Mollie Wilson, Kwakwaka'wakw pictograph recording a 1927 potlatch showing coppers and cows, ...
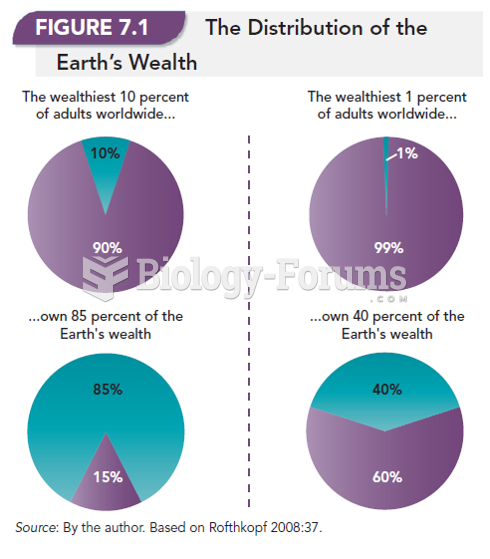 The Distribution of the Earth's Wealth
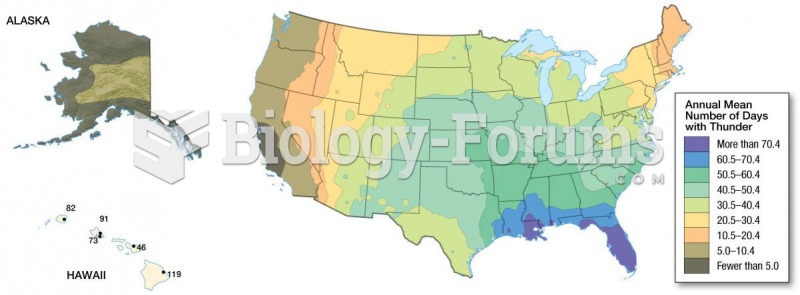 Distribution of Thunderstorms: Detailed data on cloud-to-ground lightning flashes have been ...
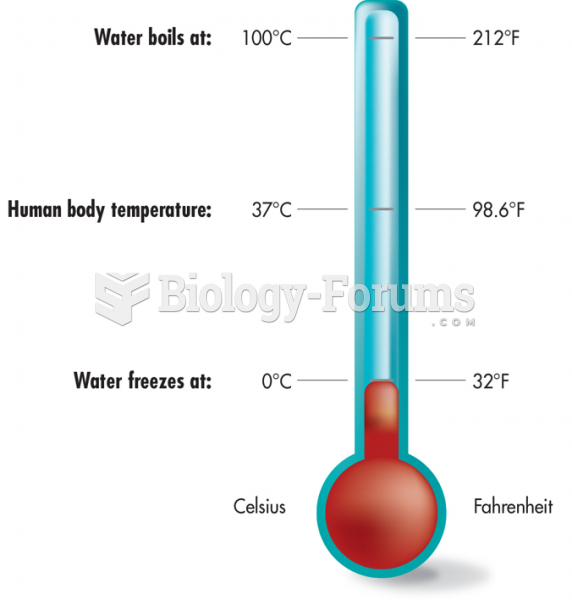 Thermometer Showing the Temperatures