This topic contains a solution. Click here to go to the answer
|
|
|

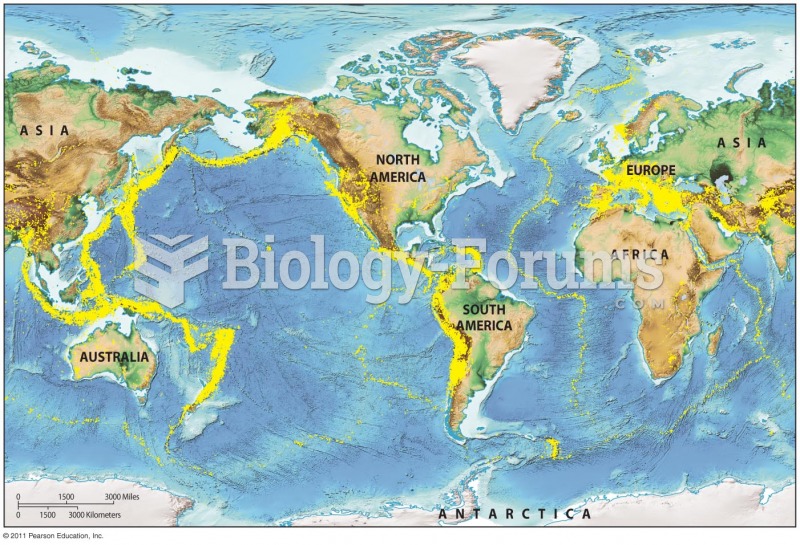 Global Distribution of Earthquakes
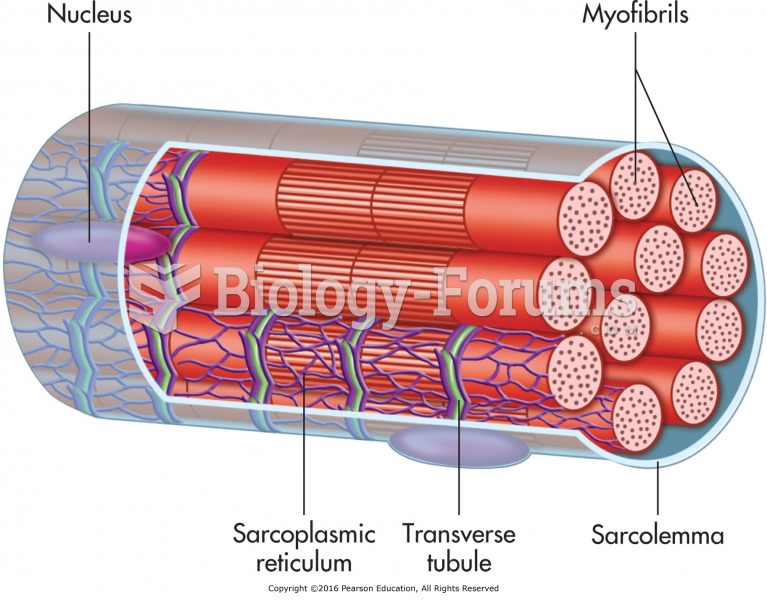 The distribution of the sarcoplasmic reticulum and tubules around myofibrils of skeletal muscle.
 Distribution and Forms of Precipitation: Graupel and Hail
 Figure of a Woman with a Drawing Showing Evidence of Original Painting and Outlining Design Scheme
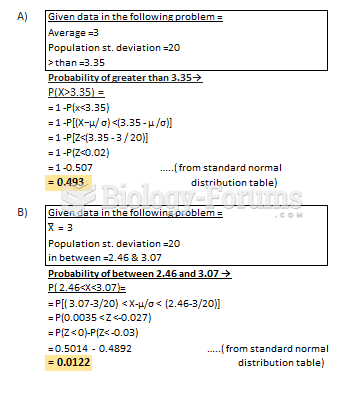 The time at which the mailman delivers the mail to Ace Bike Shop follows a normal distribution ...
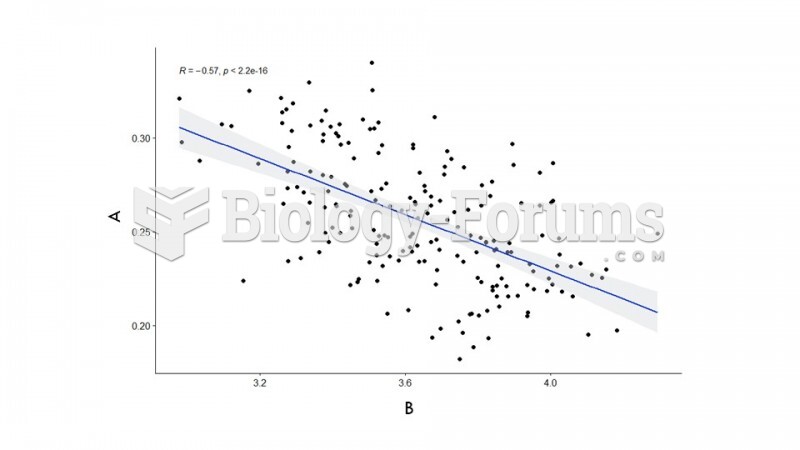 graph
graph