This topic contains a solution. Click here to go to the answer
|
|
|

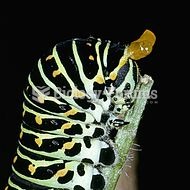 Papilio machaon caterpillar showing the osmeterium, which emits unpleasant smells to ward off predat
 Color-enhanced magnetic resonance image (MRI) showing a sagittal view of the head.
 Men and women work the same number of hours a week, but men spend more time on paid work, and women ...
 Distribution of Thunderstorms: Approximately 14.5 million thunderstorms occur each year across the ...
 How to graph quadratic equations that are in vertex form
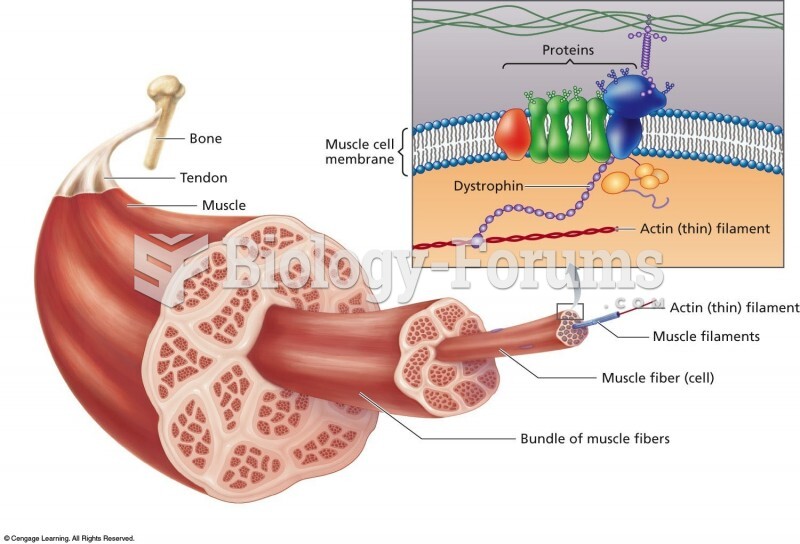 A cross section of muscle showing the molecular organization within the muscle fiber. In normal musc