This topic contains a solution. Click here to go to the answer
|
|
|

 Aerial view of a blue whale showing both pectoral fins
 Stressing that education reproduces a country’s social class system, conflict theorists point out ...
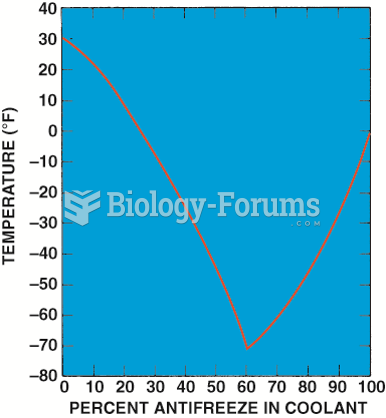 Graph showing the relationship between the freezing point of the coolant and the percentage of ...
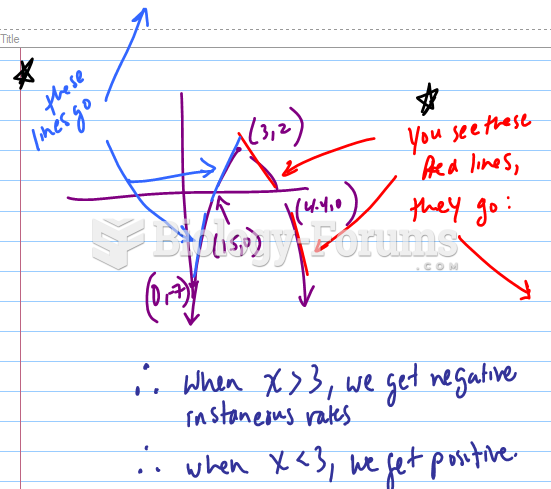 If a graph has the following x-intercepts, which value of x is the instantaneous rate of change ...
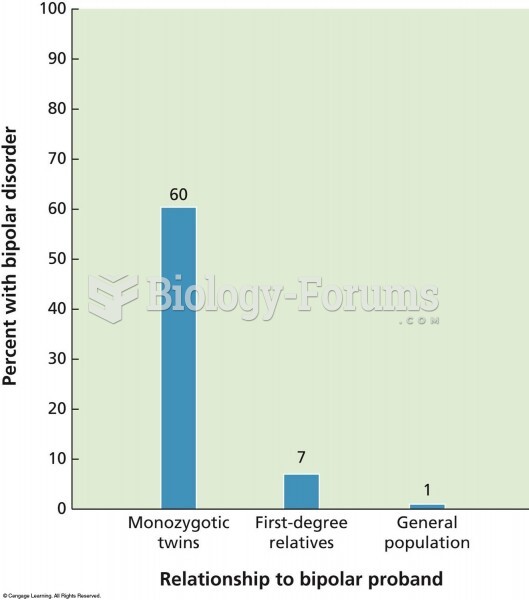 The frequency of bipolar illness in members of monozygotic twin pairs and in first-degree relatives
 Sketch the graph using the tables providing. Determine if each function is continuous or ...