This topic contains a solution. Click here to go to the answer
|
|
|

 Wasp ocelli (simple eyes) and dorsal part of the compound eyes; also showing fine, unbranched hairs
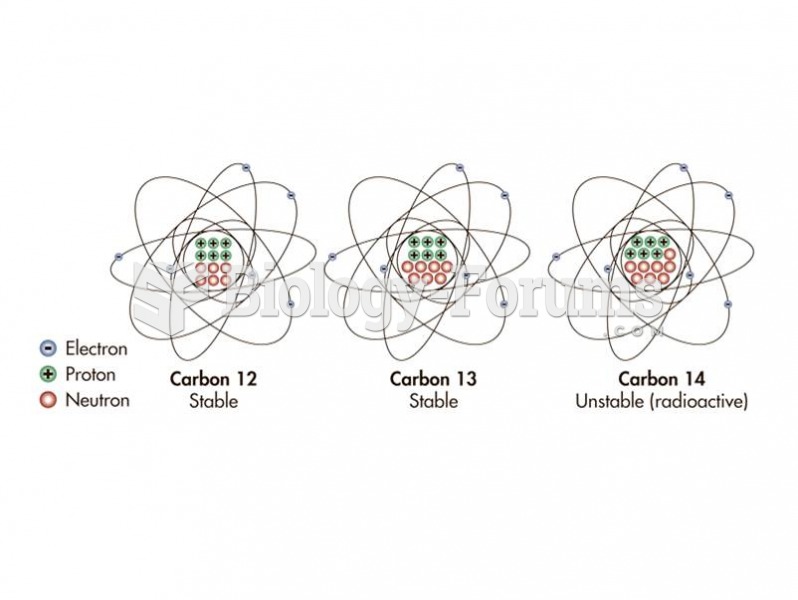 Isotopes may be stable or radioactive depending on the arrangement and number of neutrons in the nuc
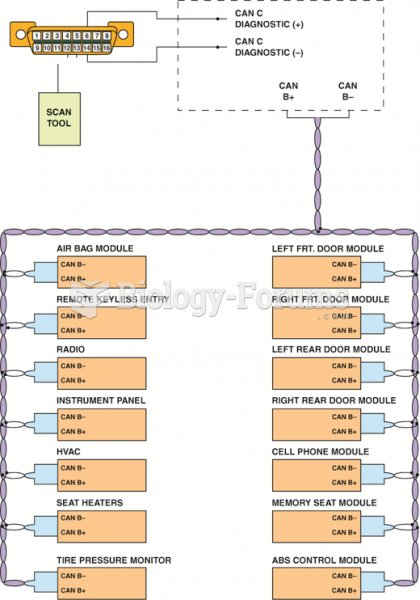 A typical bus system showing module CAN communications and twisted pairs of wire.
 Student Raises Hand in Class
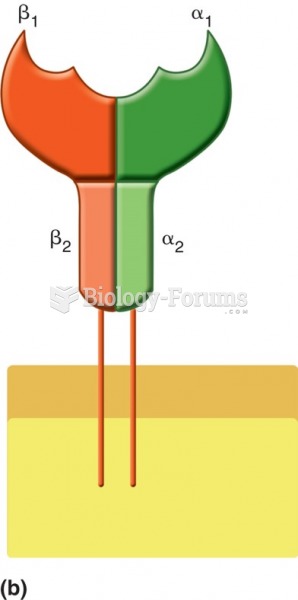 Schematic representation of MHC class II molecule, consisting of 2 α-domains and 2 β-domains, the ...
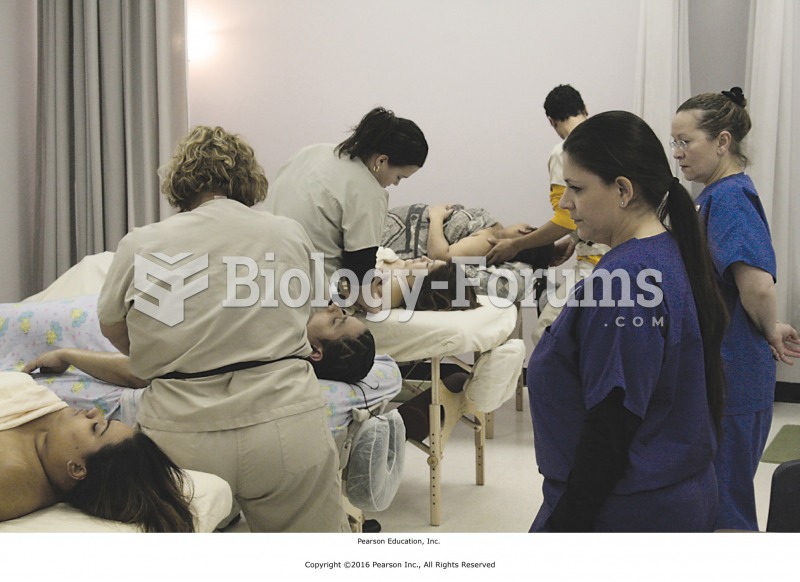 Hands-on class in a massage therapy program.