This topic contains a solution. Click here to go to the answer
|
|
|

 The asymmetrical appearance of Mira, an oscillating variable star.
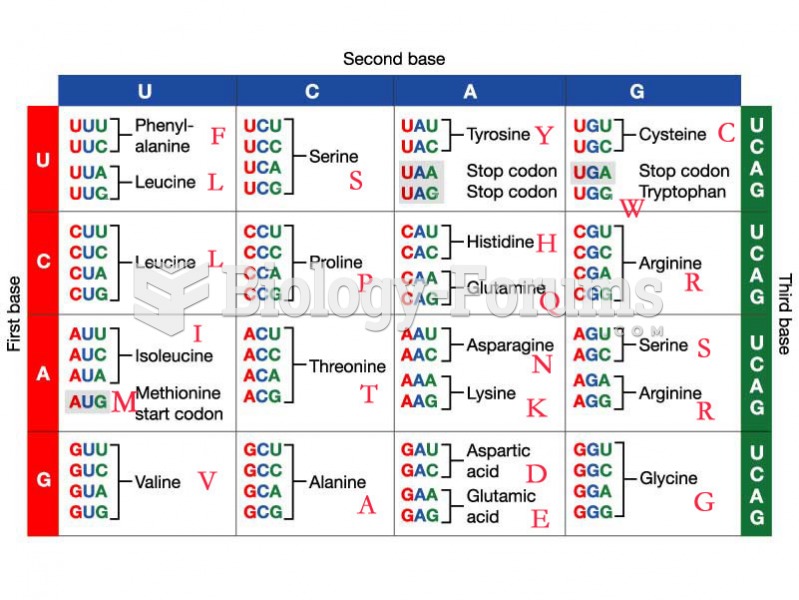 Amino acid codon chart
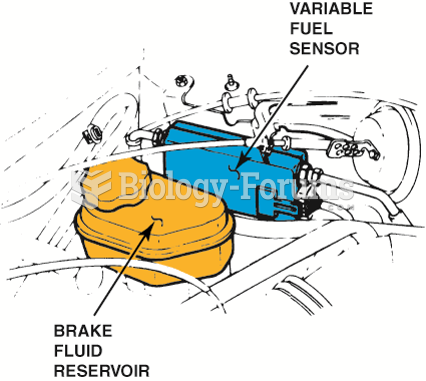 The location of the variable fuel sensor can vary, depending on the make and model of vehicle, but ...
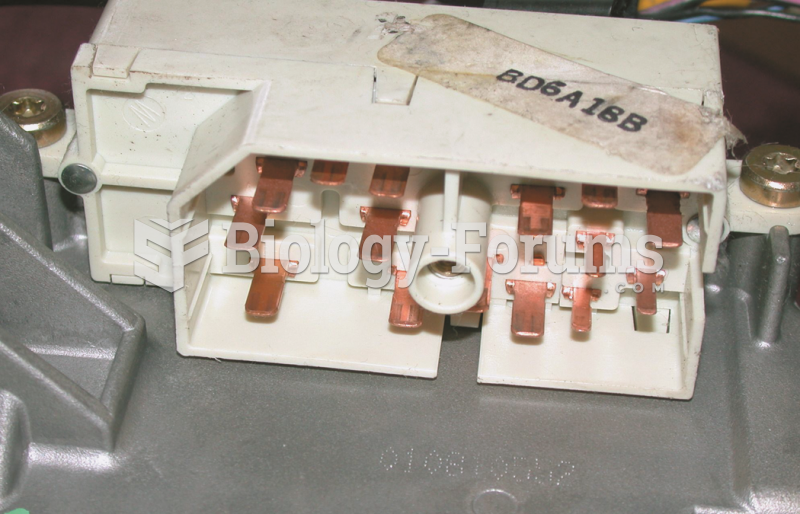 A typical ignition switch showing all of the electrical terminals after the connector has been ...
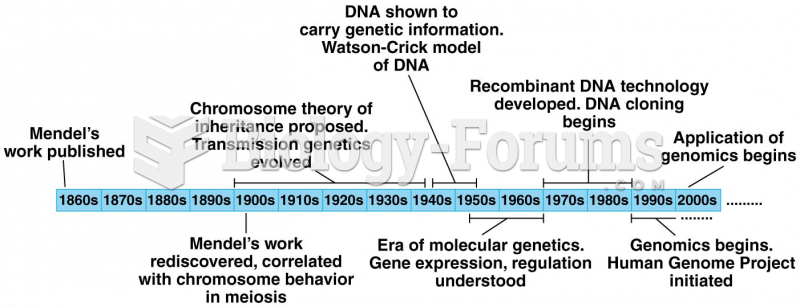 A timeline showing the development of genetics from Gregor Mendel’s work
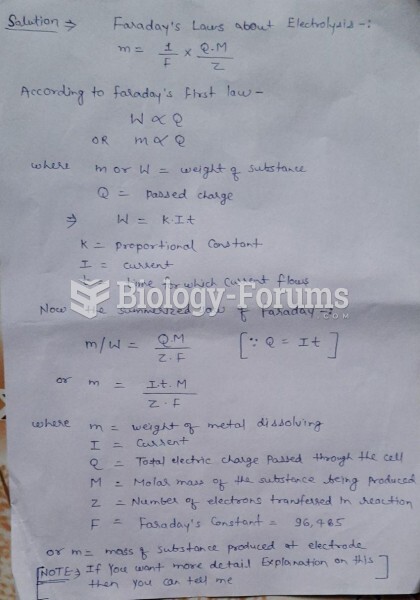 Identify the variable representing each described quantity in the equation